
A snap count is simply how many plays a player was on the field for, and it is the fastest way to tell whether a fantasy asset’s role is growing or shrinking. Used well, it tells you who to start, who to drop, and who to claim before the box score confirms it. Used carelessly, it sends you chasing garbage-time reps in a 45-point loss.
This guide walks through the whole process: where the data lives, how to normalize it, how to read a trend instead of a single-game number, and how to turn that read into an actual lineup, waiver or trade call. If you only have five minutes, jump to the step-by-step section and work down from there.
Table of Contents
- What You Need
- Step-by-Step
- Step 1: Establish the Player’s Baseline Opportunity
- Step 2: Compare Weekly and Season Trends
- Step 3: Read the Role Behind the Number
- Step 4: Apply the Evidence to Start and Sit Decisions
- Step 5: Use Snap Changes for Waivers, Trades, and Breakout Calls
- Step 6: Recheck the Story Each Week
- Snap Count Examples for Common Positions
- Common Mistakes
- Frequently Asked Questions
- How do I use snap counts for fantasy decisions each week?
- What is a good snap percentage for a fantasy football running back?
- What is the difference between snap count and snap percentage?
- Does snap percentage predict fantasy points?
- How do I find snap counts for free?
- Are snap counts accurate?
- Conclusion
What You Need
To use snap counts for fantasy decisions you need more than the raw number. The raw total is only useful next to the context that produced it, and most of the bad start-or-sit calls I have seen come from skipping that context.
Here is the short list of what to have open before you decide anything:
- Weekly snap counts and season totals for the player, plus the same for his position competitors.
- Team offensive snaps for that week, because that is the denominator that turns a raw count into a percentage.
- Touch share and target share, which show what a player actually did with those snaps.
- Route participation for receivers and tight ends, since a player can run a route without being thrown a ball.
- Opponent and game script context, because a 31-carry workload in a 30-point win tells you less than it appears to.
- Injury and depth-chart notes, including any reported snap restriction on a return.
- A three-to-four game rolling average so one strange week does not rewrite the story.
On sources: most managers already have enough data inside the tools they pay for for. Sleeper and several free stat sites show snap percentages inside the league app or a quick lookup, which makes it easy to check a player on your own roster before kickoff. For the deeper work, routes run, snap outcomes and similar-player comparisons, the bigger subscription dashboards are where those fields live. FantasyPros and FantasyLife publish sortable snap tables by position and week that are free to read, and Pro Football Reference and the league’s own official game books are the primary sources the numbers come from. The point is that you should never need more than two tabs open on a Tuesday.
Step-by-Step
The process below is the same every week regardless of position. It takes about ten minutes per player once you have the habit, and it is the difference between guessing and having a reason.
Step 1: Establish the Player’s Baseline Opportunity
Start by converting the raw count into a share. Divide the player’s snaps by his team’s total offensive snaps and you get his snap percentage, which is comparable across a 60-play game and an 80-play game. That one step kills most of the bad analysis, because raw totals punish fast-paced teams and punish players on teams that run more plays than anyone else.
Then classify what you are looking at. A stable role looks like a share that has sat in the same band for four or more weeks. A temporary role looks like a jump that started the week a starter went down and will likely reverse. A one-game opportunity looks like a single spike with no follow-up, often a player who was on the field because of a tie on the depth chart or a late defensive adjustment.
You can tell them apart by looking back, not forward. If the same number has shown up three weeks running, call it a role. If it appeared once, call it an event and price it accordingly.
Step 2: Compare Weekly and Season Trends
Compare last three games against the season average and the difference is where the information lives. A running back sitting at 45% of snaps in each of the last three weeks against a 60% season average is losing work, even though his raw total still looks respectable. The reverse is the breakout signal people miss.
Two adjustments keep you honest. First, check the opponent and the pace of the team you were playing, since a slow, run-heavy opponent inflates offensive snap totals for everyone on that offense. Second, separate signal from noise by asking whether the change held for more than one week. A single 5% move is weather. Three consecutive moves in the same direction is a trend.
Step 3: Read the Role Behind the Number
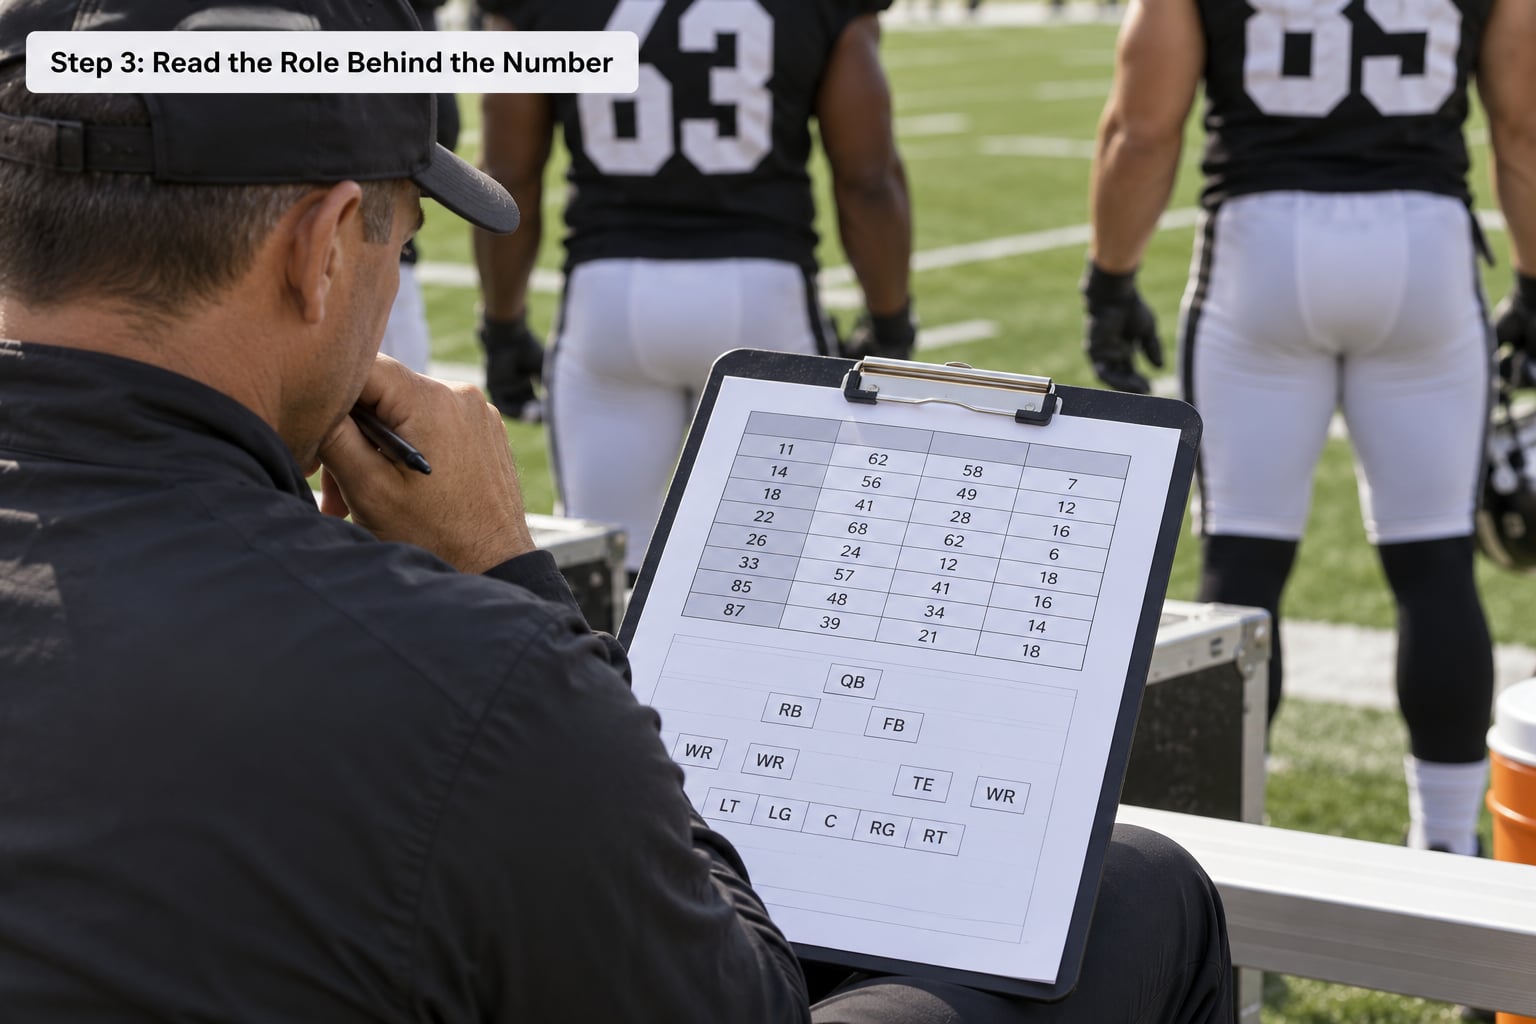
Snaps are volume, not value. What matters is which snaps. A tight end who runs routes on 85% of plays but catches two balls is being used as a decoy; a running back with 22 snaps in the opponent’s red zone is being used as a finisher. Route participation, target share and touch share convert the raw count into something you can project from.
Formation usage matters too. A wide receiver who runs a lot of snaps out of the slot or in motion has more predictable touches than one whose snaps are all at the boundary. A pass-blocking tight end with high snap share and no targets is a streaming play at best, because the snaps are not producing fantasy points.
Step 4: Apply the Evidence to Start and Sit Decisions
By this point you have a share, a trend direction and a role description. Now compare that against projected fantasy points and the matchup. Snap share sets the ceiling on targets, carries and touchdowns, so a player trending down on snaps is a projection that should be trending down too, and often nobody updates it until the box score does it for them.
The practical version: high and rising share plus a soft opponent is a start, high and falling share is a bench candidate even against a great matchup, and low share with a defined path back is a stash or a flier rather than a weekly start. On r/fantasyfootball, the recurring consensus in weekly discussion threads is that managers are usually deciding between a safe floor and a risky ceiling, and snap trend is the piece that tells you which side of that coin a player belongs to.
Step 5: Use Snap Changes for Waivers, Trades, and Breakout Calls
Rising snaps are the cheapest source of waiver-wire value there is. A player who was sitting at a 15% share and is now at 50% because the player ahead of him is out has just changed his floor, and most waiver activity is decided on name recognition rather than on that change.
For dynasty and redraft trades, snap stability is a valuation metric rather than a weekly one. A rookie who has held a 70% share for four straight weeks is a real asset with real weekly production. The same rookie at 70% once, for a reason that has since ended, is a fluke you should not pay a mid-round pick for. Role changes show up in trade values a full season before they show up in scoring.
Regression works both ways here too. A player who absorbed snaps during an injury and has since lost them is a sell candidate, and one of the most common mistakes is paying a temporary share as though it were permanent.
Step 6: Recheck the Story Each Week
Treat your snap thesis like a note in a notebook. Write down what you expect from a player based on his share and role, then check whether the actual touches and targets matched. That check is the only way to learn whether your read is right or whether you are just telling yourself a story.
Recheck injuries and depth charts before every game, since a single lineup news item can move a share by 20 points overnight. Sports Info Solutions data cited in fantasy analysis circles has been used to argue that players in the 70%-plus snap range produce fantasy points at roughly twice the rate of players under 50%, which is a reasonable argument for weighting volume heavily in your projections, but it is an average, not a promise.
Snap Count Examples for Common Positions
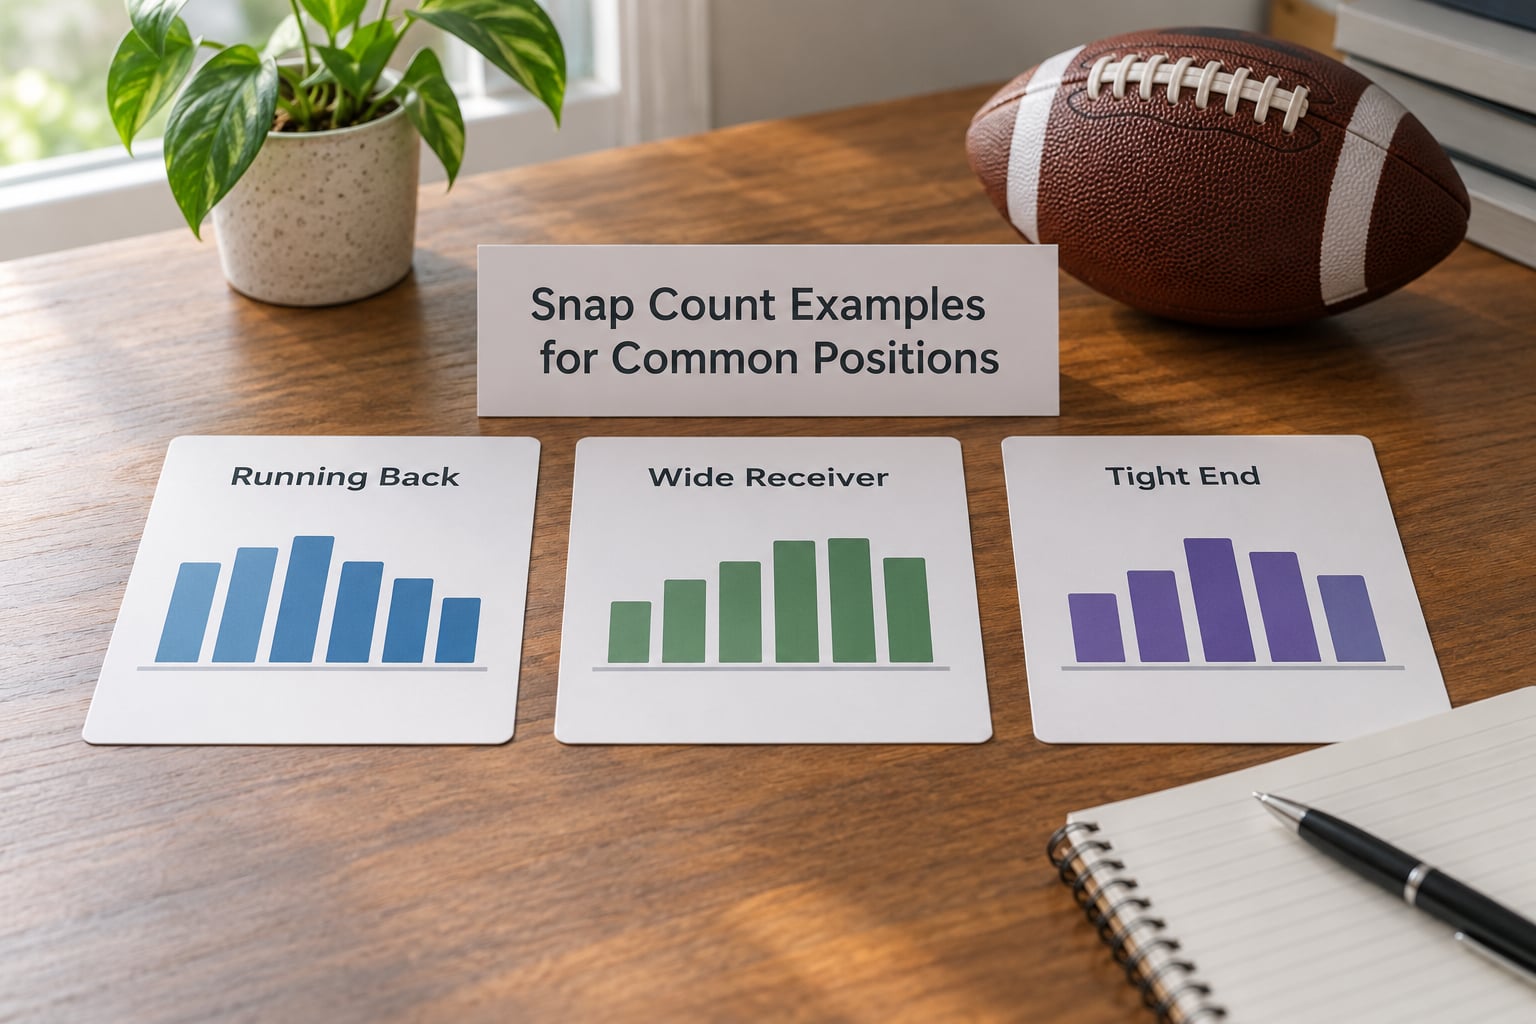
The same number means different things at different positions, and this is where most snap analysis gets misread. The examples below use illustrative share figures, not live player data.
- Quarterback: A starter at 100% of snaps has job security but a fantasy ceiling set by his offense’s play volume. Look at drop-back count and early-down passing rate instead, because a high snap total in a run-heavy offense produces a quiet fantasy week.
- Running back: 55% versus 45% in the same backfield means the two players have different ceilings. When a back is above 60% and his target share is climbing, he is usually a start regardless of the matchup, because the workload is doing the work.
- Wide receiver: A slot receiver with high snap share and no targets is being used as a decoy blocker; that share will not convert into points while the quarterback looks elsewhere. Air yards and target share are the tell.
- Tight end: 70% of snaps with a high route participation rate is the only reliable version of a “big snaps” tight end. Below 40% with two targets a game, you are streaming a touchdown, not starting a member.
- Offensive linemen: Snap count here is a workload and injury-risk signal, not a scoring one. It is genuinely useful for dynasty decisions about which line to attach IDP players to.
- Defensive players: A defender at 90% of team defensive snaps is close to unstartable-proof, while a 55% defender on a heavy run-funnel team is facing a real tackling-opportunity problem. Defensive snap percentage is the first filter for IDP streaming, and defensive backfield depth charts flip weekly enough that you should re-pull it before every lineup lock.
Common Mistakes
Almost every snap-count mistake comes from treating volume as value, or from reading one week as a trend. Here are the ones worth naming, each with the fix.
- Treating all snaps as equal. A blocking-only snap produces zero fantasy points. Fix: pair snap share with touch share, target share and red-zone touches before you project.
- Comparing raw totals across teams. Fix: always convert to percentage using your team’s offensive snap total that week.
- Ignoring game script. Blowouts produce fourth-quarter garbage-time snaps for backups who will not touch the ball next week. Fix: check the final margin and the quarter the snaps came in.
- Reacting to a single week. Fix: use a three-to-four game rolling average and require at least two weeks of confirmation before you act.
- Forgetting injury returns. A player coming back from a soft-tissue injury is often on a documented snap restriction, so a low total is a restriction, not a demotion. Fix: check the injury report language first.
- Treating a temporary share as a role. Depth-chart backups fill in, and they lose the job when the starter returns. Fix: ask whether the player ahead of him is expected back.
- Using backward-looking data after a coaching change. A new offensive coordinator can rebuild a backfield in two weeks. Fix: after any coaching news, discount the trend line and start over from the new baseline.
Frequently Asked Questions
How do I use snap counts for fantasy decisions each week?
Use them as a trend, not a snapshot. Convert the raw count to a share of your team’s offensive snaps, compare the last three weeks to the season average, then pair it with touch share, target share and role context. Rising share plus a soft opponent is usually a start. Falling share is a bench signal even against a good matchup.
What is a good snap percentage for a fantasy football running back?
For a running back in a standard committee, 55% or higher usually signals a genuine lead back worth starting weekly, especially with a rising touch share. Above 60% with goal-line work, most weeks are automatic. Below 40% means you are picking up scraps and should treat the player as a spot starter or a stash.
What is the difference between snap count and snap percentage?
Snap count is the raw number of plays a player participated in. Snap percentage divides that number by his team’s total snaps for the game. The raw count depends on how many plays the team ran, so it is not comparable between teams or between games of different pace. The percentage is the number you should be trending.
Does snap percentage predict fantasy points?
It sets the ceiling rather than guaranteeing the floor. A player cannot score on plays where he is not on the field, so higher share usually means more chances. Published tracking data has put production rates for players above 70% of snaps at roughly double those under 50%, but opportunity quality, matchup and game script still decide individual weeks.
How do I find snap counts for free?
Sleeper shows snap percentages inside the league app, which is why managers on that platform rarely need another source. Free stat sites such as FantasyPros and FantasyLife publish sortable snap tables by position and week, and Pro Football Reference and official NFL game books provide the underlying numbers. Paid dashboards add routes run, snap outcomes and similar-player comparisons.
Are snap counts accurate?
They are officially tracked and generally reliable, but they are backward-looking and they count every play equally. A snap tells you a player was on the field, not whether the snap produced fantasy points, and totals shift with pace, game script and opponent. Treat the number as the start of your analysis rather than the end of it.
Conclusion
Open your data source tonight, pick one player you are actually deciding on, and pull their last four weeks of snap percentage next to their touch and target share. Compare that line to the player ahead of them and to the matchup this week, then make the call. Repeat that ten-minute check every week and your lineup decisions will start to come with a reason attached instead of a hunch.