
If you want to know how to age curve players in dynasty leagues, the answer is short: you age curve them with position-specific age bands, real workload data, and role security, never with a birthday alone. A 27-year-old running back on a declining team and a 27-year-old quarterback with three years of starting ahead of him are two completely different assets.
This guide walks through a five-step process I use every offseason, plus the position age windows that feed it. It takes about 90 minutes for a 30-player roster if your sheet is already built.
One note before we start. When people search “aging curve,” they often land on baseball sabermetrics explainers about WAR by age. That is not what we are talking about here. In dynasty football, an aging curve is the average pattern of how a player’s fantasy production rises, peaks, and fades across his career. It is a planning prior, not a schedule with a cliff marked on it.
Table of Contents
- What You Need
- Step-by-Step: How to Age Curve Players in Dynasty Leagues
- How old is too old for a dynasty roster?
- How do you estimate a player’s remaining career?
- How should production trends change a player’s age curve?
- How do you turn the age curve into a trade or roster decision?
- Common Mistakes
- Frequently Asked Questions
- What age should dynasty league managers rebuild around?
- Should age curve players differently in redraft and superflex leagues?
- How do I account for injuries when aging a dynasty player?
- Is it better to trade an older star or sell low?
- How often should I update player age-curve projections?
- Can rookie production be used to predict a long dynasty career?
- Conclusion
What You Need
Before you judge a single player, gather these inputs. If you skip the workload data, you are just guessing with extra steps.
- Current age and position. Your league’s age setting (some start at 21, some at 23) matters more than most managers assume.
- Role and opportunity. Snap share, route participation, target share, carries per game, and red-zone touches. These are the raw materials of a projection.
- Contract or draft-capital context. A fourth-round pick on a rookie contract has a different value than a 29-year-old on a three-year deal.
- Three seasons of production trend. One good year is noise. You want the direction of the line, not a single point.
- Injury and availability history. Games missed and the reason for each one.
- A spreadsheet. One row per player, one column per input. Free data tools like nflfastR or your league’s own player pages will fill most of it.
If your sheet has only a name column, you are not aging curve players. You are reacting to last season.
Step-by-Step: How to Age Curve Players in Dynasty Leagues
How old is too old for a dynasty roster?
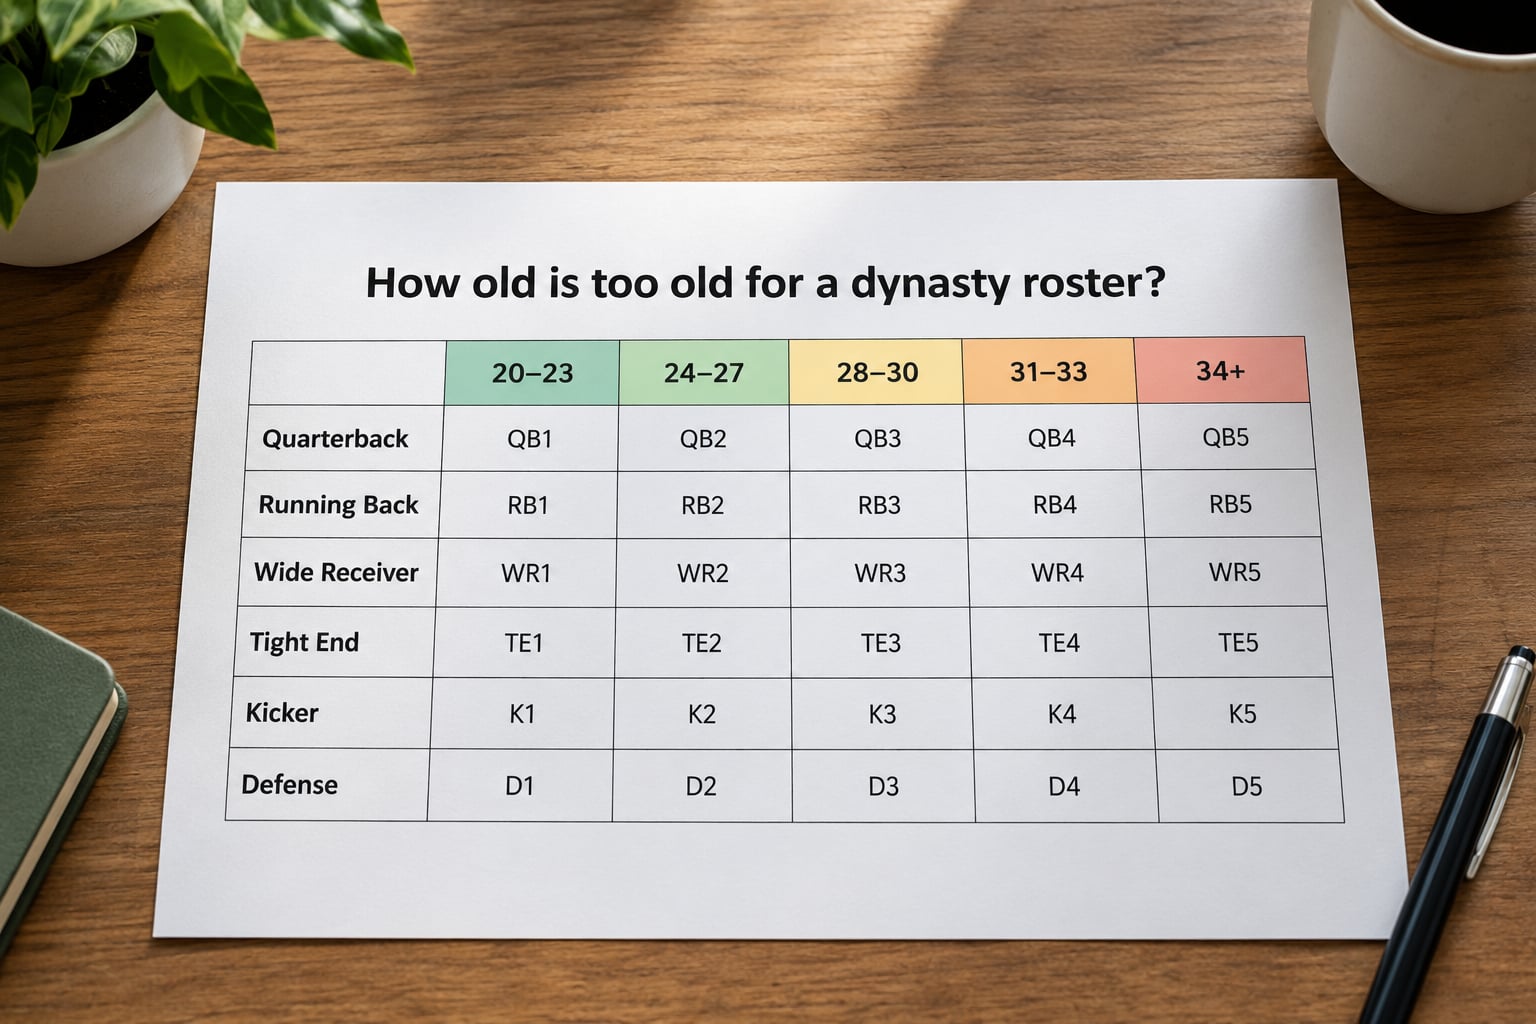
There is no universal cutoff, and anyone who gives you one is selling something. A quarterback at 34 with three years of guaranteed volume left is a hold. The same age at running back with 240 carries is a fire sale. What matters is how many productive seasons remain at that position’s typical rate, not the number on the ID card.
These are working bands, not laws. Use them to screen your roster in ten minutes, then move to the deeper steps.
| Position | Buy window | Peak window | Decline window |
|---|---|---|---|
| Quarterback | 21-25 | 26-33 | 34+ |
| Running back | 21-23 | 24-26 | 27+ |
| Wide receiver | 21-24 | 25-29 | 30+ |
| Tight end | 21-25 | 26-29 | 30+ |
| Offensive line | 21-25 | 26-30 | 31+ |
| Defensive backs and linebackers | 21-25 | 26-29 | 30+ |
| Defensive line | 21-26 | 27-30 | 31+ |
The reason the running back window is so tight comes down to workload, not physiology. A team replaces a running back far more easily than a quarterback, so volume disappears earlier. Receivers and tight ends get a second act because route trees expand with experience and injuries elsewhere create volume.
Screen first, then judge. A roster with eight players past their position’s buy window and zero rookies is not a roster that declines slowly. It is one that stalls.
How do you estimate a player’s remaining career?
Estimate remaining productive years, not remaining NFL years. Plenty of players suit up at 36 and produce nothing. You are underwriting fantasy-relevant seasons.
Build the estimate from five inputs, weighted in this order.
- Position baseline. Start from the decline column in the table above. A 30-year-old tight end starts from the fact that most tight ends are already past it.
- Role security. Is this player locked into a starting job, or competing for one? A starter with no credible backup has a longer window than a starter who will be replaced by a rookie the team drafted for exactly that role.
- Workload trajectory. Rising target share at any age signals stability. Falling carries at 25 signal a shorter window than falling carries at 32, because there is more runway to lose them.
- Physical indicators. Position-specific, not vibes. For a running back, look at yards after contact and break-run rate. For a quarterback, look at pressure-to-sack rate and how he performs when hit.
- Injury history. Two ACL tears in three years is not an injury history. It is a role change. A player who has missed eight games in each of the last two seasons should have a productive-years estimate one full year below his position baseline.
Do not average these into a single number without weights. Role security and workload matter more than physical indicators for most positions, because fantasy production is mostly opportunity.
How should production trends change a player’s age curve?
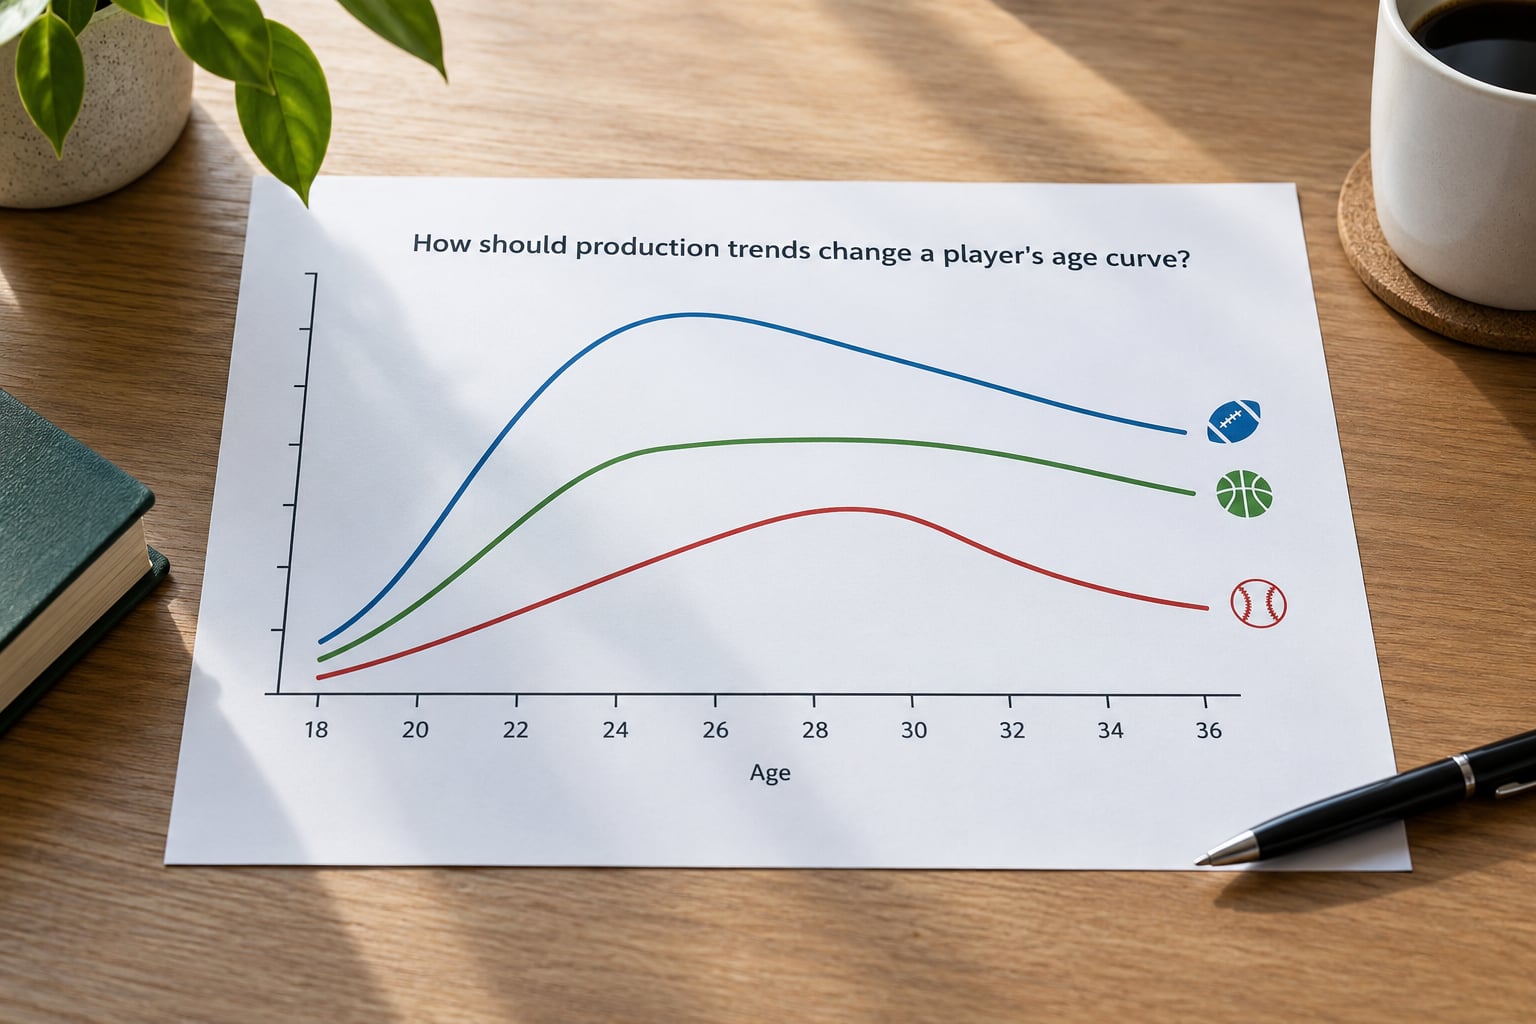
A trend only tells you something once you know which phase of the curve the player is in. Five patterns show up on nearly every roster.
- Early-career role expansion. Targets, snaps, and touches climbing across two seasons. The curve is still bending upward and you extend the estimate. This is the buy window doing its job.
- Peak production. Flat or slightly rising production at a peak-window age. Hold, and price in two to four more solid seasons.
- Role reduction. Production drops while a teammate’s rises. The age curve has not moved, but this player’s curve has shifted left. Cut the estimate by a season and start shopping.
- Injury-related change. Production falls, but the underlying role did not. Check whether he would rebound in a healthy season before you sell.
- Late-career volatility. Big swings in week-to-week production with a downward trend. Treat the average as unreliable and discount heavily. This is where a spreadsheet of the last six games tells you more than a season total.
The distinction that matters most is between role reduction and aging decline. Role reduction is fixable if the situation changes; a free agent leaves, a coach switches back to an older look. Aging decline is not.
How do you turn the age curve into a trade or roster decision?
Once you have a remaining-season estimate, convert it into an action by comparing what the player will produce against what it costs you to replace him.
| Age band | Contender action | Rebuilder action |
|---|---|---|
| Inside buy window | Hold and build around | Accumulate, stash on rookies |
| Peak window, ascending | Trade up if you need the production now | Trade for picks and older assets |
| Peak window, flat | Hold one more season | Shop early in the calendar |
| Decline window, still producing | Buy at a discount if the discount is real | Flip for a younger asset |
| Decline window, role shrinking | Cut immediately | Cut and replace with upside |
Then check replacement cost. A 28-year-old wide receiver on your roster is replaceable if your waiver wire still has a 24-year-old with a similar target share. A starting quarterback is not, no matter his age.
Timing is where most managers leak value. In r/DynastyFF, managers inheriting aging orphan teams repeatedly say the same thing: the trade deadline is too late to sell a veteran, because buyers are already focused on the season in front of them. Sell during the offseason and draft window, when the league is still building rosters and everyone is shopping.
Watch the discount too. In some leagues even contenders refuse to take veterans, which pushes prices below what the decline actually justifies. That is not a problem to fix. It is a discount to collect, and it is the single most reliable edge available in aging-curve thinking.
Common Mistakes
Applying one age cutoff to every position. Cutting a 30-year-old wide receiver and a 30-year-old quarterback with the same rule is the most common error on rosters I audit. Correction: screen by position band first, then judge inside the band. Tip: sort your roster by position, then by age, so the sort itself does the triage.
Valuing last season’s production. A career year built on 390 targets does not repeat if the quarterback changes. Correction: project from expected opportunity, not from the total. Tip: write down where this player’s targets are coming from next season before you decide anything.
Ignoring role entirely. Two players at the same age on the same team can have opposite curves if one is the unquestioned starter. Correction: name the specific role and estimate its duration. Tip: find out who the backup would be and how much draft capital the team put on them.
Treating an injury as temporary without evidence. The optimistic read gets a player one season of grace he never uses. Correction: subtract a full year per major injury from the baseline estimate and ask what happens if it happens again. Tip: write down the injury-adjusted estimate before the general one, so the pessimistic number stays visible.
Projecting once and forgetting. A sheet built at the start of a rebuild and never reopened is worse than no sheet. Correction: revisit every player at the trade deadline and again after the draft. Tip: put a recurring calendar reminder for the first week of March and again in September.
Buying age as a virtue on its own. Youth with no path to a role is an expensive hobby. Correction: a young player is only valuable if the depth chart has a hole he fills. Tip: for every rookie on your roster, write one sentence on what he would have to beat out. If you cannot, he is a roster filler, not an asset.
Frequently Asked Questions
What age should dynasty league managers rebuild around?
Most managers rebuild when three or more starters sit past their position’s buy window and the roster has no rookie production coming. For a quarterback-driven roster, 27-28 is usually the signal; for a running back roster it can be 26, because the decline window opens earlier. Count current starters past their buy window before counting age, since two 25-year-old backups are worse than one 30-year-old star.
Should age curve players differently in redraft and superflex leagues?
Yes, and superflex is the bigger adjustment. Because quarterbacks are scarce and stay relevant longer, the QB buy window shifts earlier, roughly 20-24, and the decline window stretches to 35 or beyond. In redraft, where there is no long-term equity, most managers should treat age as almost irrelevant to current output and optimize for this season only. Dynasty superflex rewards carrying a 34-year-old starter far more than a standard roster does.
How do I account for injuries when aging a dynasty player?
Subtract a full productive season from your estimate for each major injury, then add a role adjustment. A player who missed eight games in two straight seasons should sit at least one year below his position baseline, and further if his replacement was a draft pick. Separately, check whether the injury changed his role rather than his output. Rebuilding a burst receiver after a hamstring is different from aging a lineman after a torn ACL.
Is it better to trade an older star or sell low?
Trade the older star if the return still funds a competitive window; sell low only when the market is discounting more than your decline estimate justifies. Managers on r/DynastyFF consistently report the trade deadline being too late, because buyers focus on the season ahead. The practical window is the offseason and draft period, when rosters are still being assembled and older players are cheapest.
How often should I update player age-curve projections?
Three times a season is enough: once after the draft, once after training camp when roles firm up, and once at the trade deadline. Add a fourth pass in January if you plan to trade during league startup. The input that changes most is role, and roles settle after camp. Re-running the numbers every week mostly produces motion rather than information.
Can rookie production be used to predict a long dynasty career?
Only as a rough ceiling. Rookie production is heavily influenced by opportunity and role, not talent alone, which is why so many rookies fall off in year two. Use it to confirm that the player has a role, then judge the ceiling on draft capital, physical profile, and route tree commitment. A 1.5-point-per-game rookie season on heavy volume is a stronger signal than a quiet one on a bad offense.
Conclusion
Start with the smallest useful action. Open your roster, sort it by position, and mark every player who has passed their position’s buy window. For each of those, write down the role, the workload trend, and an honest estimate of productive seasons left.
Then compare that estimate against what the player is currently worth to you. That single comparison, done across 30 players once a year, is the whole method. It takes about ninety minutes and it will tell you more than any age chart on the internet, including the baseball ones.