If you want the short version: to use target share in fantasy football, divide a player’s targets by his team’s total pass attempts, then judge that percentage against his position, his role, and his team’s actual pass volume. The whole read takes about fifteen minutes a week if you know which numbers to pull. It is a volume measure, not a scoring forecast, which is exactly why it is useful.
Most managers find target share by accident, usually after a player has a strange game. The box score says six targets, the line says 9.2 fantasy points, and nobody has a good answer for why a supposedly high-volume player did so little with it. Target share fixes that gap, because it answers a different question: how much of the passing game belongs to this player right now.
Below is the process I use, in the order I use it.
Table of Contents
- What You Need
- Position benchmarks to start from
- Step-by-Step: How to Use Target Share in Fantasy Football
- Step 1: Confirm What Target Share Measures
- Step 2: Find the Player’s Baseline and Recent Trend
- Step 3: Contextualize Targets by Position and Player Role
- Step 4: Pair Target Share with Conversion and Efficiency
- Step 5: Compare Players Within the Same Player Pool
- Step 6: Update the Interpretation Every Week
- Common Mistakes and Tips
- Frequently Asked Questions
- What is a good target share for a wide receiver?
- How do I calculate target share in the NFL?
- Should I use target share in my fantasy football draft?
- Does a high target share always mean more fantasy points?
- How current does target share data need to be?
- Conclusion
What You Need
Target share is the percentage of a team’s pass attempts that a specific player is targeted on. If a quarterback throws 40 passes in a game and 12 of them go to one wide receiver, that receiver posted a 30% target share. The formula is simple: the player’s targets divided by the team’s total targets, multiplied by 100.
A target, in plain terms, is a pass thrown to a specific player that he could reasonably catch. Completions are receptions. Targets are the attempts, hit or miss, and that difference is why target share is a volume stat and not an efficiency one.
Position benchmarks to start from
These are rough working thresholds, not laws. A wide receiver on a pass-heavy team can live at 20% and have a big season. The same number from a tight end in a two-tight-end offense means something completely different.
| Tier | Wide receiver | Running back | Tight end |
|---|---|---|---|
| Elite | 25%+ | 20%+ | 22%+ |
| Strong | 20-24% | 14-19% | 16-21% |
| Average | 15-19% | 8-13% | 10-15% |
| Concerning | under 15% | under 8% | under 10% |
You need a place to get the numbers. FantasyData and Fantasy Points Data both publish weekly target totals and splits. Pro Football Focus has the deepest version, including air yards and average depth of target, but the best of it sits behind a paywall, which is the single most common complaint in the r/fantasyfootball thread about this metric. FantasyHistoryData is useful for pulling historical share alongside snap counts. Sleeper and Stathead cover volume, though not always in the same one place.
You also need the supporting stats, because target share on its own is half a picture. Grab snap count and snap percentage, route participation, air yard share, average depth of target, red zone targets, catch rate, yards per target, and total team pass attempts. Nine numbers, one screen, about fifteen minutes.
The last thing you need is a role label for every player in your pool: alpha, rotational, committee, blocking-only, or red zone specialist. Target share means nothing until you know what job the player actually has.
Step-by-Step: How to Use Target Share in Fantasy Football
Step 1: Confirm What Target Share Measures
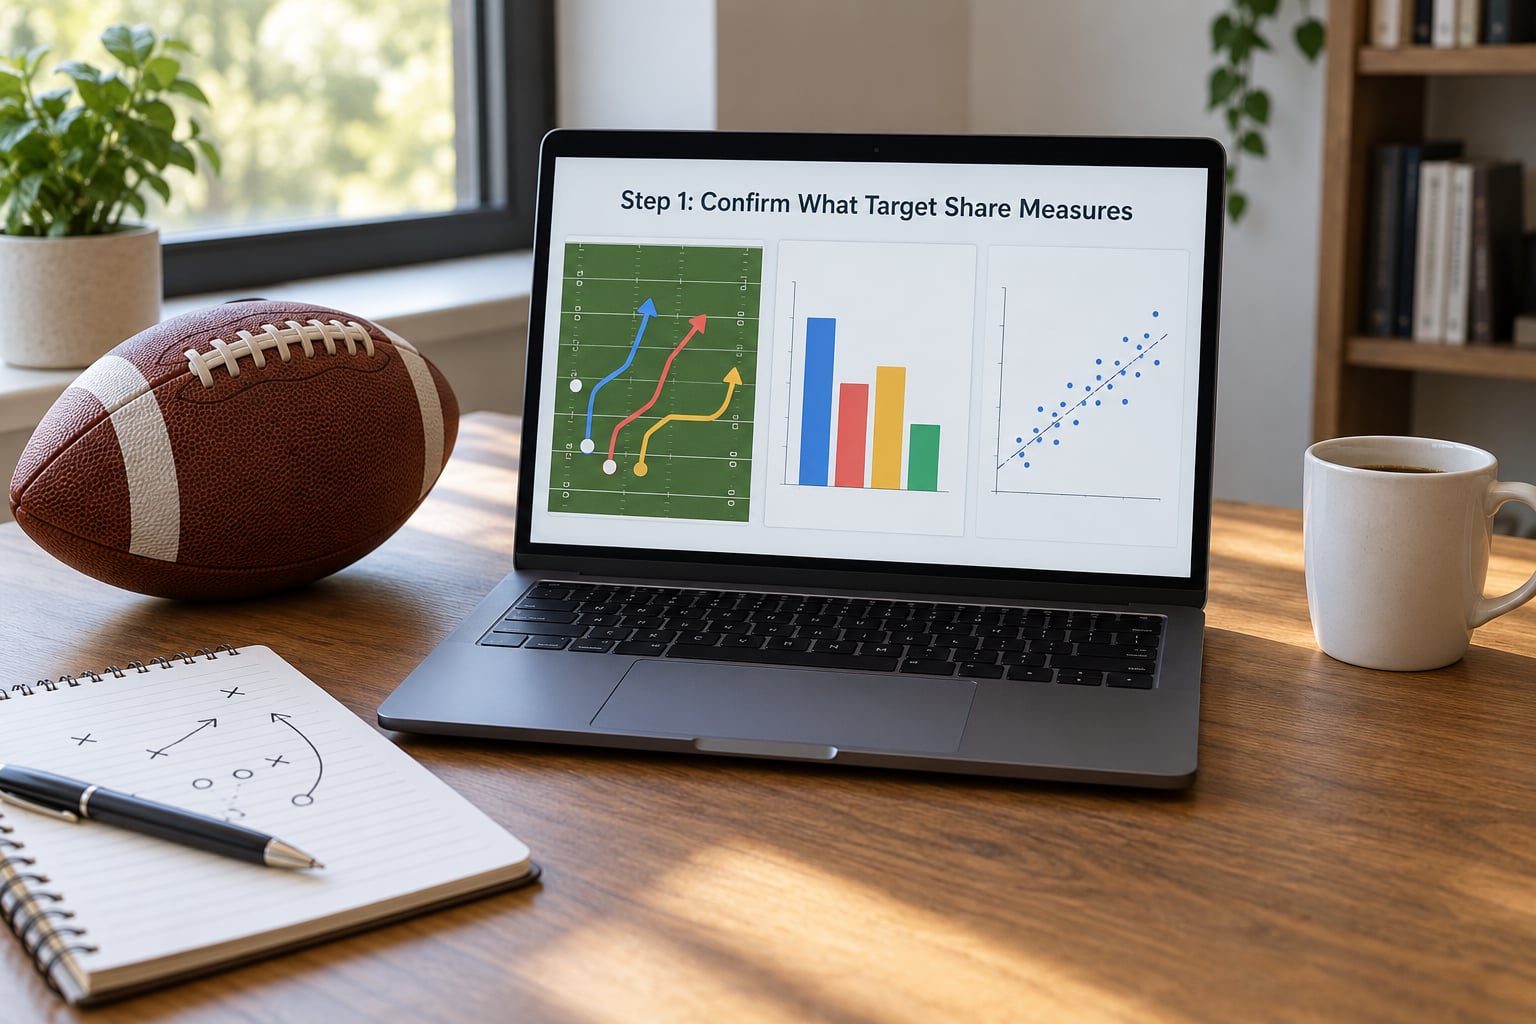
Target share measures only the air volume pointed at a player. It does not measure receptions, yards, touchdowns, or how often the ball went somewhere else in the offense. A receiver with a 28% share and a quarterback who throws 20 passes a game is not a 28% player. He is a 28% player off a 20-attempt diet.
This is the mistake that makes people quit using the metric. A high share is a claim on future opportunity, nothing more. What happens after the ball arrives is a separate question, answered by catch rate, depth of target, and where on the field the target happened.
Step 2: Find the Player’s Baseline and Recent Trend
Pull the season-long share first, because that is your baseline, then layer the last three, four, or six weeks on top. A player sitting at 19% over the season who has run at 27% for three straight weeks is changing roles, not just getting lucky.
Watch the sample size as you go. One week of 40 attempts produces a 5% share as easily as a 30% one. That is volatility, not information. Three to 4 weeks is the minimum I trust for a trend read, and six is better, because it usually covers a bye and one bad matchup.
Then check the reasons behind the movement. A new starting quarterback, a scheme change, an injury ahead of the player, or a coaching change will each move a share for a reason. A share that moves with no explanation is usually game script, and game script reverses.
Step 3: Contextualize Targets by Position and Player Role
Position is not a footnote to target share, it is the whole reading. A running back posting a 28% target share is a genuinely rare event, because it means his quarterback is actively choosing to pass to him rather than handing off. A wide receiver at 28% inside a run-heavy offense with 25 pass attempts is a much thinner signal.
Tight ends need the most care. Count targets only when the quarterback is looking for a pass. A tight end whose targets all come on play-action and empty-backfield situations has a real number. A tight end padded with check-downs at 22% while his offense runs 30 times has an inflated one.
Role matters just as much. A player’s route participation tells you whether he is even on the field enough to be targeted. High share with low route participation usually means one big red zone day is doing all the work.
Step 4: Pair Target Share with Conversion and Efficiency
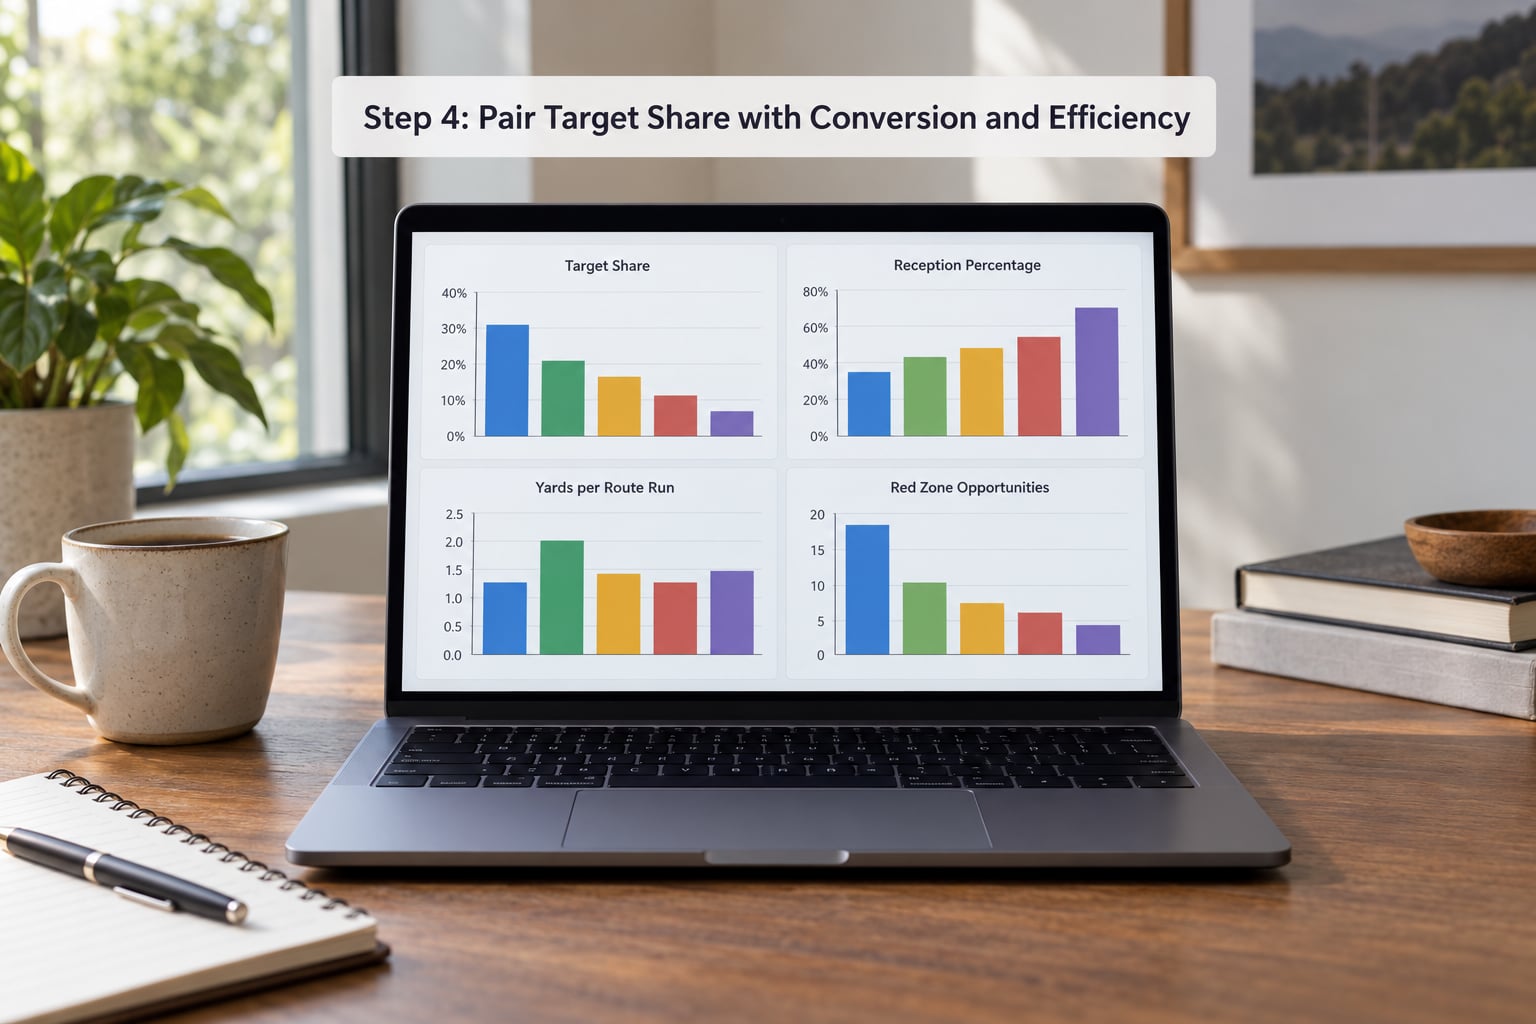
Volume tells you how many chances arrive. Efficiency tells you what those chances are worth. Put catch rate next to target share and a big gap opens up: a 27% share on a 55% catch rate is a low floor, while a 22% share on a 75% catch rate has a real weekly floor even on a quiet day.
Average depth of target explains the rest. Deep targets inflate share without producing repeatable points, which is why a receiver living at 15 yards per target can post a monster share and a quiet score. Shallow targets are the opposite problem. They keep a PPR player on the board every week.
Add red zone targets and goal line touches, because that is where the extra points live, then add the number that gets skipped most often: total team pass attempts. League leaders throw far more than the bottom third, so the same share means different things in different games. A player on a team averaging 32 attempts needs less share to reach the same ceiling than a teammate on a 22-attempt team.
On r/fantasyfootball, the recurring pattern is that people pair air yard share with target share in a spreadsheet and project from there. That habit is sound. Volume plus depth is a much better projection than volume alone.
Step 5: Compare Players Within the Same Player Pool
Target share is a tiebreaker, not a ranking. Put it to work only between players competing for the same job, because comparing a slot receiver’s share to a boundary player’s share tells you about the route tree, not about value.
For waiver decisions, take the two available players and ask which one owns the higher share going forward. If the difference is two or three points, look at air yard share and role instead. If it is eight or more points, the volume gap usually settles it on its own.
For start or sit calls, the useful question is upside. Two receivers at 24% and 19% are not equivalent: the higher-share player has more ways to hit eighteen points in a week. That does not mean start him automatically, but it does mean the case for starting him is a case about volume, which is easier to defend than a hunch.
For trades and drafts, the same logic runs in reverse. A player being drafted as a low-volume flex but already holding a 24% share is a market misread, and that gap is where value hides. In dynasty leagues the read stretches even further out, since sustained role is worth more than a six-week burst.
Step 6: Update the Interpretation Every Week
Weekly is the only useful cadence, and the update is cheap. Five things should change your read: a new starting quarterback, a coordinator or scheme change, an injury ahead of or behind the player, a jump or drop of five or more points in share across two weeks, and any change in red zone or designed-touch usage.
Be slow to change your mind on small movements. Target data also lands later than people expect, so the share you are reading on Tuesday morning may already be stale. That is a common complaint in the forums and it is fair, so build the check into one fixed session each week rather than reacting to whatever posted overnight.
Common Mistakes and Tips
Reading a share as production. Volume sets a ceiling, not a floor. Catch rate, depth of target, and scoring format decide what happens under that ceiling, so check your league settings before you let a percentage make a decision for you.
Ignoring team pass volume. Thirty percent of 45 attempts is a very different week than thirty percent of 22. Divide by the attempts before you react, every time.
Trusting a single week. A 5% share in one game is a data point, not a verdict. Require at least three weeks of trend before you change a lineup or a roster plan.
Applying one threshold to every position. A 28% running back share and a 28% wide receiver share are opposites in meaning, one of them scarce and one of them expected.
Counting a tight end’s pass targets in run-heavy game scripts. Check whether the quarterback was actually looking for the pass, or whether the tight end was just the last name on the check-down list.
A few habits that help. Sort your whole league by share inside your own position group, then read down the list instead of at one player. Write down the share number before you look at last week’s fantasy points, so the number gets your honest opinion rather than the other way round. And keep the total team attempts column on the same sheet. It takes one extra click and it changes how you read every other number you have collected.
Frequently Asked Questions
What is a good target share for a wide receiver?
For a wide receiver, 25% or higher usually signals a clear number one role, 20-24% is a strong share, 15-19% is average, and anything under 15% puts your starting case on touchdowns. Context still matters: the same 20% is stronger on a team averaging 35 pass attempts than on one averaging 22.
How do I calculate target share in the NFL?
Divide the player’s targets by his team’s total targets for the same game or period, then multiply by 100. If a quarterback throws 40 passes and 12 go to one receiver, that is 12 divided by 40, or 30% target share. Always divide by team attempts, not by league-wide totals, or the number means nothing.
Should I use target share in my fantasy football draft?
Use it as supporting evidence, not as a ranking on its own. A high share on a rookie or a player in his second year tells you the role exists, which is what usually predicts a breakout. Pair it with route participation, air yard share, and the depth of target before you decide that a late-round target is worth the risk.
Does a high target share always mean more fantasy points?
No. Target share measures volume, while points come from conversion. A receiver with a 28% share and a 52% catch rate on deep passes can post fewer points than a teammate with an 18% share and a 75% catch rate on short passes. Read the share together with catch rate, average depth of target, and total team attempts.
How current does target share data need to be?
Weekly is the right cadence, and once a week is enough. Many free data sources post after the weekend, so the share you read early in the week may already be a few days old. That is usually fine, since the number informs the trend rather than the single game. Weekly updates also keep you from overreacting to one strange week.
Conclusion
Start by opening one page of target data for your position group and sorting by share, then check each player’s snap percentage, air yard share, and team pass attempts before the percentages go anywhere near a lineup decision. Target share tells you where the ball is going. Efficiency, role, and scoring tell you what that is worth. Used together, once a week, they replace most of the guessing that goes into start, sit, waiver, and trade calls.