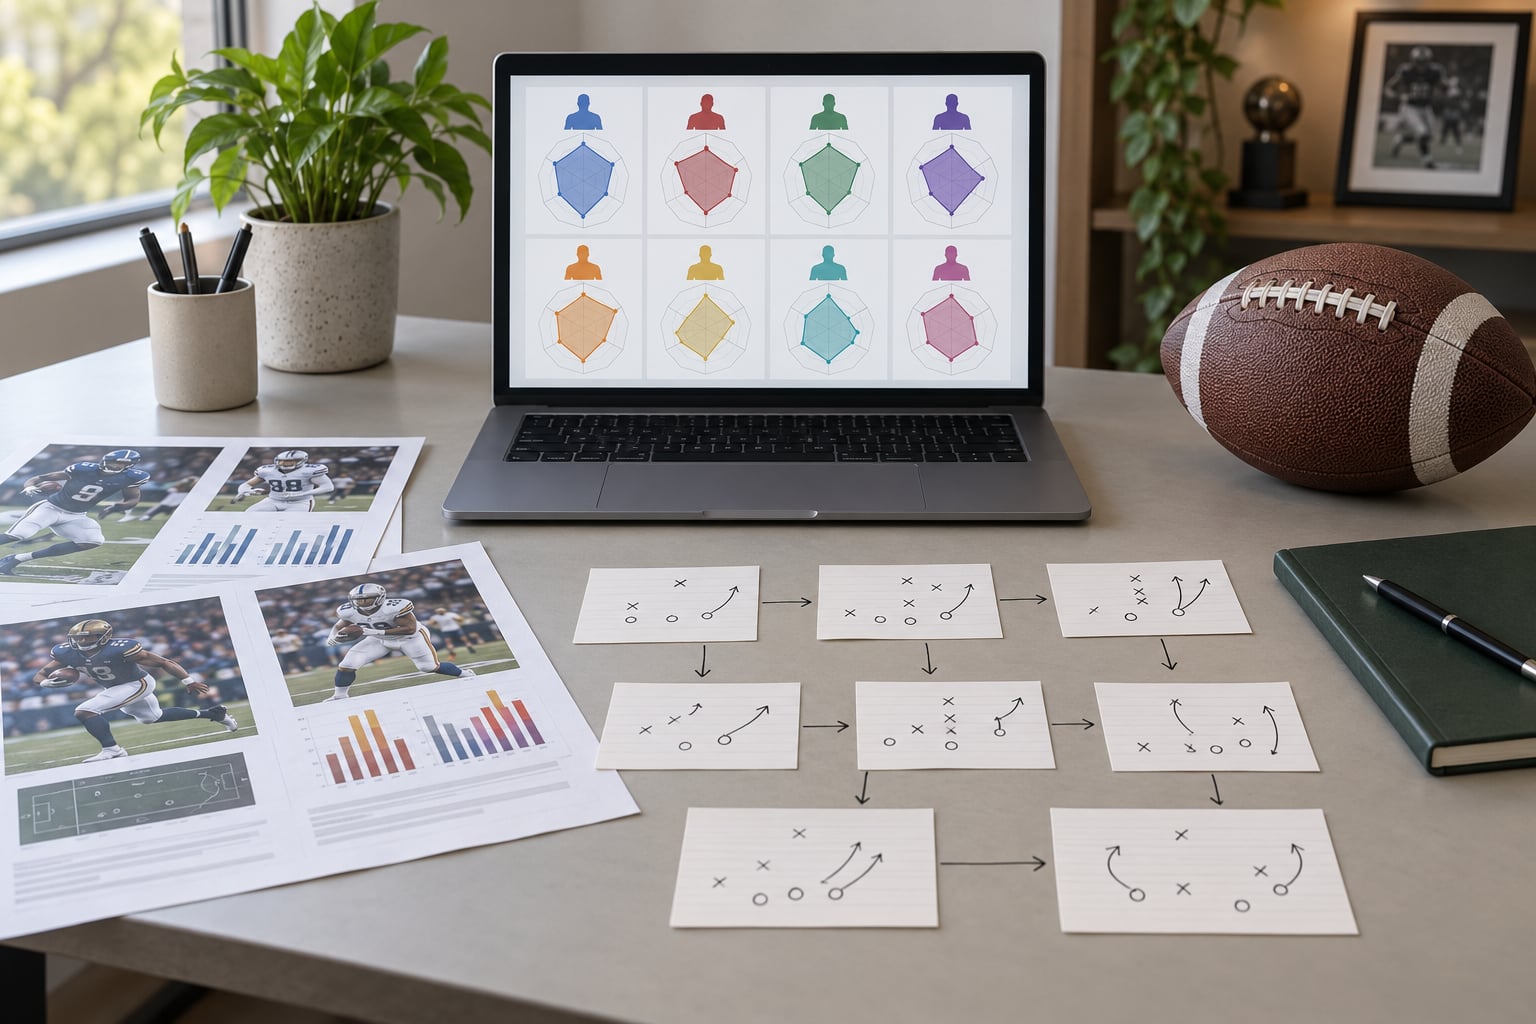
If you want to know how to identify a sophomore slump candidate before your draft, compare opportunity first and points last. A second-year player whose snaps, targets or carries dropped, who got no replacement role, and whose draft price still reflects a bigger workload is the profile to fade. A player whose numbers dipped on identical volume for three weeks is usually just variance.
The word “slump” makes managers nervous for the wrong reason. Most of what gets called a sophomore slump is not a curse attached to a player’s second season. It is arithmetic: a rookie year inflated by touches that no longer exist, followed by a draft board that prices the inflated year instead of the real one.
That makes slump detection a repeatable screen rather than a gut call. The eight signals below are the ones I check, in this order, for every breakout name on my board before deciding whether to fade, buy or avoid.
Table of Contents
- Sophomore Slump Candidate Signals at a Glance
- What Is a Sophomore Slump in Fantasy Football?
- How Do You Compare Rookie and Sophomore Production?
- Which Eight Signs Point to a Sophomore Slump?
- Falling Usage and a Narrower Role
- Worse Efficiency With Similar Volume
- A Changed Offense or Supporting Cast
- Health, Competition, and Draft Expectations
- How to Tell a Slump From a Breakout Hype Reset
- What Action Should You Take for a Slump Candidate?
- Frequently Asked Questions
- Is a drop in fantasy points enough to label a player a sophomore slump candidate?
- What is the most important statistic for identifying a sophomore slump?
- Should I sell a struggling second-year player during redraft leagues?
- How do quarterbacks and running backs show sophomore slumps differently?
- Can a favorable schedule hide a player’s underlying decline?
- What to Do First
Sophomore Slump Candidate Signals at a Glance

Here is the whole screen in one table. No single row proves a slump, but three or more flashing at once is a pattern worth pricing into your draft board.
| Signal | How to measure it | How strong the signal is |
|---|---|---|
| Snap share falls | Snaps per game as a share of the team’s offensive snaps, rookie year vs. now | Strong |
| Target or carry share drops | Targets or carries per game, and the player’s share of team attempts | Strong |
| Red-zone work disappears | Red-zone targets and goal-line carries per game | Strong |
| Efficiency falls on similar volume | Yards per route run, yards per carry, catch rate, touchdown rate, explosive-play rate | Moderate |
| Feature role becomes committee role | Third-down, two-minute and play-action work compared to year one | Strong |
| The offense around him changed | New coordinator, new starting quarterback, new scheme, departed teammates | Context only |
| Health caps the sample | Games played and games missed, plus any recurring injury notes | Context only |
| Draft price outran the role | Average draft position against projected games, share and role | Moderate |
What Is a Sophomore Slump in Fantasy Football?
A sophomore slump is a second-year NFL player’s decline in fantasy production relative to an outsized rookie season, and it is almost always caused by lost opportunity. Touches, targets and role shrink, points per game fall with them, and the player is labeled a bust when the real problem is that his job got smaller.
So is the slump real? Not as a curse, yes as a mechanism. Managers on forums keep arriving at the same place: the phrase describes a real, repeatable pattern of lost role, and it does not describe bad luck attached to a birthdate. If you are drafting and someone tells you a player is “due” because he is a sophomore, that is the superstition talking.
Before you screen anyone, rule out the four things that look like a slump but are not:
- Ordinary regression to the mean. A rookie who caught 70 percent of his targets was never going to keep that up. Some decline is arithmetic, not decline in talent.
- Schedule luck. A soft schedule can inflate year one. Judge the role, then adjust the schedule separately.
- Injury-driven volatility. A missed month changes volume without saying anything about ability.
- Expected growth. Some second-year players dip in raw totals and expand their role at the same time. That is a buy, not a slump.
How Do You Compare Rookie and Sophomore Production?
Total points are the worst baseline you can pick, because a six-game rookie season and a full 17-game one are not comparable. Start with per-game rates, then convert them into shares so you are measuring a piece of a pie that may have gotten bigger.
Target share is simply a player’s targets divided by his team’s dropbacks. Touch share is carries plus targets, divided by the team’s total plays from scrimmage. Snap share tells you how often he was even on the field. Those three numbers answer the question fantasy points cannot: did he get less of the work, or did he convert the work worse?
Yards per route run is the cleanest efficiency stat for receivers and tight ends. Yards per carry and success rate carry the same job for running backs. For quarterbacks, completion percentage over expected tells you whether a dip is the scheme or the passer.
| Position | Baseline stat to track | My warning threshold | What that stat misses |
|---|---|---|---|
| Quarterback | Attempts per game, red-zone attempts, rushing attempts | Attempts per game under 80 percent of the rookie average | Supporting cast quality and scheme efficiency |
| Running back | Carries, targets, goal-line carries, touch share | Carries under 15 per game with no goal-line work | Efficiency, which can survive a volume cut |
| Wide receiver | Targets, routes run, air yards share, deep target rate | Target share under 17 percent | Catch rate, which drives points more than volume |
| Tight end | Routes run, targets in 11-personnel groups, red-zone targets | Fewer than 3.5 red-zone targets per game | Scheme reliance on one coordinator |
Treat those numbers as rules of thumb, not laws. Schedule, opponent strength and game script move every one of them week to week, which is exactly why the thresholds are percentages of a player’s own baseline rather than league averages.
Which Eight Signs Point to a Sophomore Slump?
These are not eight automatic sell signals. They are eight variables that interact, and the order they fire in matters more than the number of them. Role loss is the serious one. Efficiency wobble is the weakest.
Falling Usage and a Narrower Role
Sign one is a snap share that has not come back to the rookie level. A player running 70 percent of team snaps as a rookie and 55 percent in year two has been pushed into a smaller job, whatever his box score says. This is the most reliable signal on the list because roles do not usually shrink by accident and then recover on schedule.
Sign two is volume in the form that matters for the position. For a receiver, that is targets and routes, not catches. For a running back, it is carries and goal-line touches, not yards. A running back with 14 carries a game and no goal-line work is a committee back in a workhorse package, and that is a different player than the one you drafted.
Worse Efficiency With Similar Volume
Sign three is the one that gets over-weighted. Stable volume with lower efficiency is more concerning than a volume drop alone, because a player who is still getting the ball is being beaten by defenses rather than by the depth chart.
Here is the arithmetic. A rookie wide receiver puts up 78 catches on 128 targets and 9.1 yards per route run. In year two he keeps 120 targets, a 4 percent drop that reads as stability, but his catch rate falls from 61 to 49 percent and his yards per route run falls to 7.0. The target share says nothing changed. The efficiency numbers say the difference between a 130-point season and an 85-point one, and no amount of schedule luck explains a 12-point yardage drop that repeats for six weeks.
Sign four is red-zone disappearance. Touchdown luck reverses hard in year two, but losing the red-zone snaps entirely is a role change, not a variance event.
A Changed Offense or Supporting Cast
Sign five is a new coordinator, a new starting quarterback or a scheme that no longer fits the player’s strengths. Context does not condemn a player on its own. Stable underlying usage through a coaching change is evidence the player is absorbing the change, and that is often the moment to buy.
Sign six is a supporting cast that left. A quarterback’s top target departed, a starting tackle moved on, the run-heavy coordinator was replaced by a pass-heavy one. Track the player’s share through the change: if the share holds and the points fall, the decline is about quality of opportunity. If the share falls too, the job itself got smaller.
Health, Competition, and Draft Expectations
Sign seven is health, and I want to be careful here. Games played and games missed are facts; what an injury means for a career is not something a manager should diagnose. Use availability as a discount on the sample, then re-run the screen once a full healthy stretch exists.
Sign eight is the one people skip and shouldn’t. A high pick, a top-12 rookie finish and an average draft position that assumes 90 percent snap share is a pricing problem, not necessarily a talent problem. Competition matters here too: a team that spent a first-round pick on a player at the same position has already answered the question about touches, whatever the depth chart says in July.
How to Tell a Slump From a Breakout Hype Reset
Plenty of second-year players decline and plenty of them break out, and the same screen separates both. The difference is which direction the volume moved.
| Situation | What it looks like | What to do |
|---|---|---|
| True negative trajectory | Snap share, targets and red-zone work all down; efficiency down on top of it | Do not pay last year’s price; fade in redraft |
| Positive regression | Touches up, role expanded, points down because touchdowns fell | Buy low and start him |
| Schedule artifact | Role intact, soft schedule in year one, tougher slate now | Adjust projections, not the player grade |
| Second-year learning curve | Volume stable, processing still visible, efficiency noisy | Hold through the early weeks, re-screen at week six |
| Improving prospect | Route participation, third-down work and target quality all rising | Add on the waiver wire before the points arrive |
Take a fictional example. A rookie wide receiver finishes on 68 catches as a third option with a 14 percent target share. Year two, his quarterback changes, the team drafts a receiver ahead of him, and his target share falls to 12 percent. His catches fall to 41. Nothing about his talent declined, and nothing about his role improved. That is a pricing problem, and in a redraft league the answer is to pass at a mid-round asking price.
What Action Should You Take for a Slump Candidate?
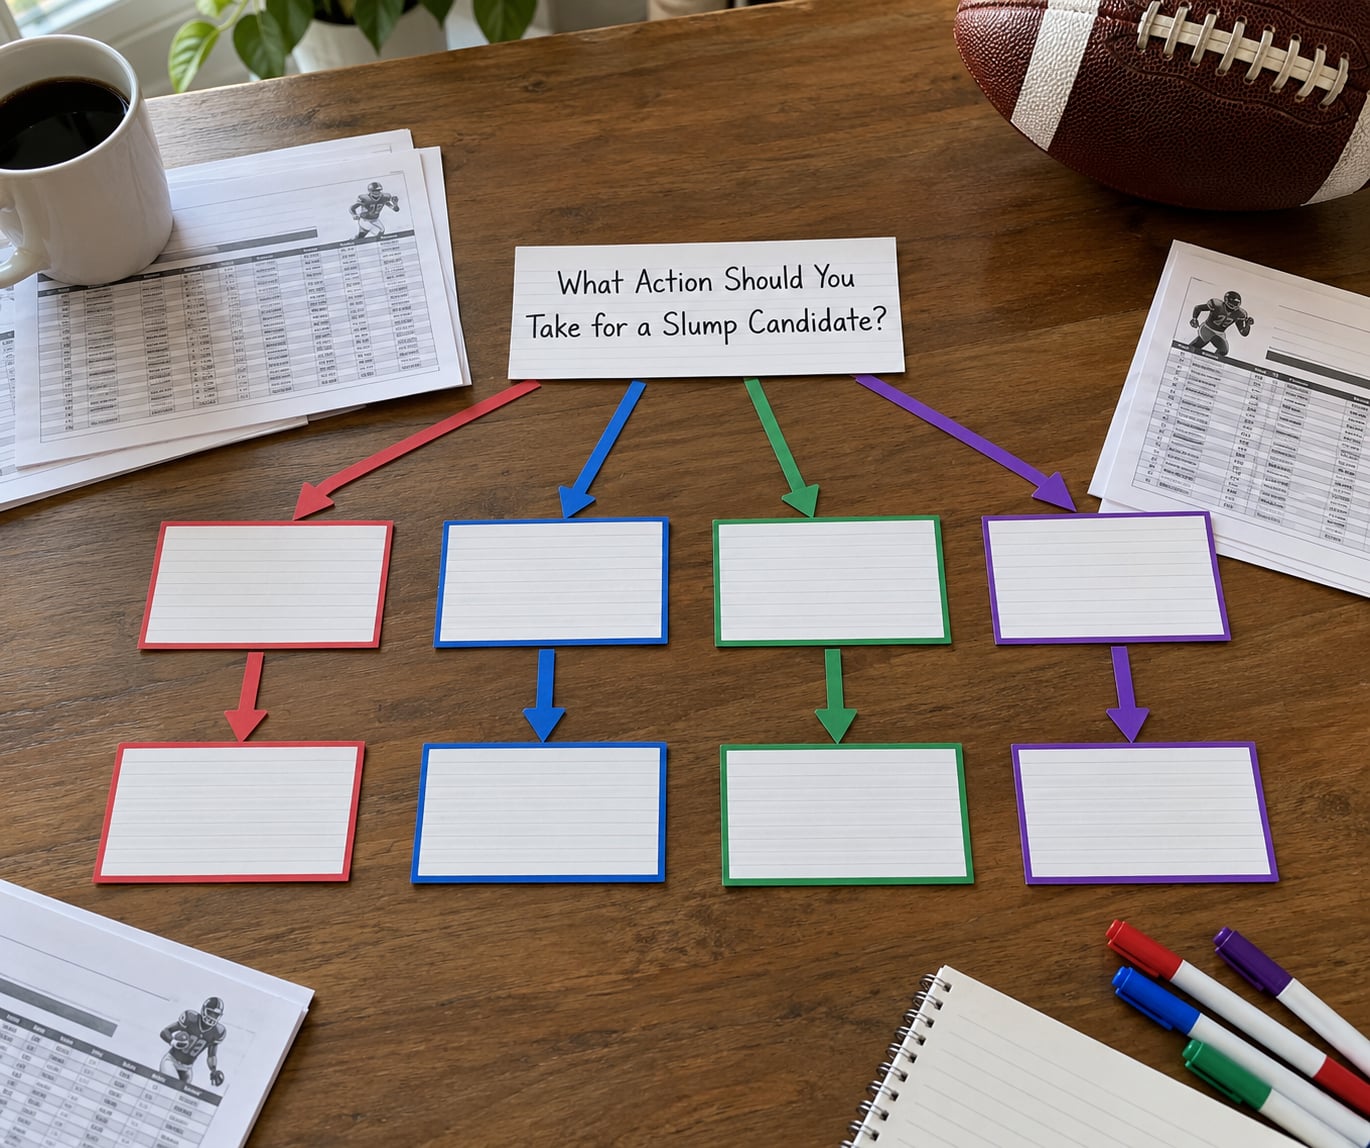
The action follows the evidence, and the evidence follows the screen. Work down this list in order and stop at the first branch that fits.
- Role intact, efficiency down. Hold or add. This is a buy, and in dynasty it is often the cheapest asset on your bench.
- Role shrinking, efficiency fine. Bench in redraft, hold in dynasty only if the situation can reverse. Projects get three weeks to prove the workload is back.
- Role shrinking and efficiency down. Drop in redraft. Sell in dynasty to the manager who still sees the rookie year.
- Sample too small to judge. Do nothing dramatic. Re-run the screen at week six with a full body of work, and do not sell a player on a two-game sample.
- Price already reflects the decline. This is the good case: no role and no efficiency loss, but ADP has fallen to a level that pays you for the uncertainty.
Thresholds differ by format, and pretending otherwise is how managers talk themselves out of good trades. In redraft, a shrinking role is enough reason to pass on a player drafted inside his old role, because you only need him for one season. In dynasty, you own the whole arc, so hold through a single down year unless the trend is clear at the halfway point. In best ball, only the ceiling matters, and a player whose role is expanding is a hold no matter what the efficiency table says. Scoring matters too: in PPR a lost reception is a bigger loss than in standard, so target share carries more weight than yards per game in those formats.
Frequently Asked Questions
Is a drop in fantasy points enough to label a player a sophomore slump candidate?
No. A points drop is an outcome, not a diagnosis, and it is the last thing you check. Compare per-game volume and snap share against the rookie year first. If the player still gets the same snaps, targets and red-zone work, a lower total is usually efficiency variance or touchdown regression. The candidate label needs lost opportunity plus a price that has not adjusted.
What is the most important statistic for identifying a sophomore slump?
Target share for receivers and tight ends, and touch share for running backs, because they normalize for how many snaps the offense takes. Raw per-game numbers flatter a fast offense and punish a slow one. Snap share is the useful backstop: when all three fall together, the role genuinely shrank and the decline is structural rather than statistical.
Should I sell a struggling second-year player during redraft leagues?
Dropping is usually the wrong word in redraft, because you are managing one season rather than an asset. Pass on him at his expected draft price and only add him if the price falls below the new role. Selling in a redraft league means trading mid-season, which is a different market with different risk. Reserve the trade for dynasty formats, where a manager may still be pricing the rookie year.
How do quarterbacks and running backs show sophomore slumps differently?
Quarterbacks show it in volume and in support: attempts per game, red-zone attempts and rushing attempts fall when a team commits elsewhere, and completion percentage over expected separates scheme problems from passer problems. Running backs show it in role, because a committee decision is binary and instant. Fewer than 15 carries a game with no goal-line work ends the workhorse case regardless of efficiency.
Can a favorable schedule hide a player’s underlying decline?
Yes, in both directions. A soft slate can keep a declining player’s floor high, and a tough one can bury a break-out. The way around it is to grade the role on share metrics that are schedule-neutral, then adjust projections for schedule separately. That keeps you from selling a healthy player after a bad four-game stretch, or keeping a fading one through a kind one.
Short version: to identify a sophomore slump candidate, find a player whose share of snaps, targets and touches fell in 2026, whose efficiency fell with it, and whose draft price still assumes the old job. That is the whole screen.
What to Do First
Start with role and volume, not with the box score. Pull last year’s snap share, target share and touch share for every breakout name on your board, then compare them to the first five weeks of 2026. Only when the volume is down do you test efficiency, health, competition and trend. Most managers run that order backwards, which is why they fade healthy players and keep declining ones.