A DFS ownership projection is a model’s estimate of the share of competing lineups that will include a given player on a given slate. To read one properly, confirm the field and contest format behind the number, then weigh it against projected fantasy points, salary and roster construction. Ownership is a measure of what other managers will likely do, not a measure of how many points a player will score, and treating it as anything else is the fastest way to build a lineup that looks contrarian without finishing any higher than the crowd.
This guide runs about ten minutes to read and no extra time to apply. It assumes you have access to at least one paid projection tool, but the process works just as well with a free optimizer if you know which inputs to check.
Table of Contents
- What You Need
- Step-by-Step: How to Read DFS Ownership Projections
- Confirm the Data Behind the Percentage
- Separate Projected Points from DFS Value
- Identify the Source of the Projection
- Judge Ownership Relative to Your Player Pool
- Check Late Updates and Real Contrarian Edge
- Common Mistakes
- Treating Projected Ownership as Certainty
- Ignoring the Contest Type
- Chasing Every Low-Owned Player
- Comparing Percentages Across Field Sizes and Sites
- Using Ownership Without Salary and Projected Points
- Frequently Asked Questions
- What is a good ownership percentage for a DFS contrarian play?
- How are projected ownership percentages calculated?
- Should I fade players with ownership above 50%?
- Is low projected ownership useful in cash games?
- Can I compare ownership percentages from different DFS sites?
- Conclusion
What You Need
Before an ownership percentage tells you anything, you need the context it was built on. Here is the short list.
- Player projections — projected fantasy points for every player on the slate, on the specific site you are entering.
- Salary and roster rules — the salary cap, positional requirements and lineup construction for your site. A player who looks cheap on one platform is not automatically cheap on another.
- Field size and contest type — cash game, double-up, small-field tournament or large-field GPP. This changes what an ownership number means more than anything else.
- Ownership rates with a timestamp — when the percentage was produced, and by whom.
- A way to record assumptions — a note on your phone or a column in your spreadsheet. Write down the contest you are targeting and the ownership number you acted on.
You do not need a specific tool. RotoGrinders, FantasyLabs, NumberFire, 4for4 and Establish The Run all publish ownership projections, ESPN shows its own ownership figures alongside player projections, and DraftKings and FanDuel surface roster percentages inside their own lobby and lineup tools. DraftKings Milly Maker gives you a rough sense of pure random field composition, which is useful context when you want to know how much of the field is built without any logic at all.
What you do need is comparable data. Numbers from two different field sizes are not comparable, and neither are numbers produced from different scoring settings. Projections also move as the week goes on, so an ownership number you saved on Tuesday and a number from Sunday morning can both be correct and still point you at completely different lineups.
Step-by-Step: How to Read DFS Ownership Projections
Five steps, in order. Skipping ahead to step four is the most common mistake, because deciding which players are worth fading before you know what the number represents is how people end up contrarian for no reason.
Confirm the Data Behind the Percentage
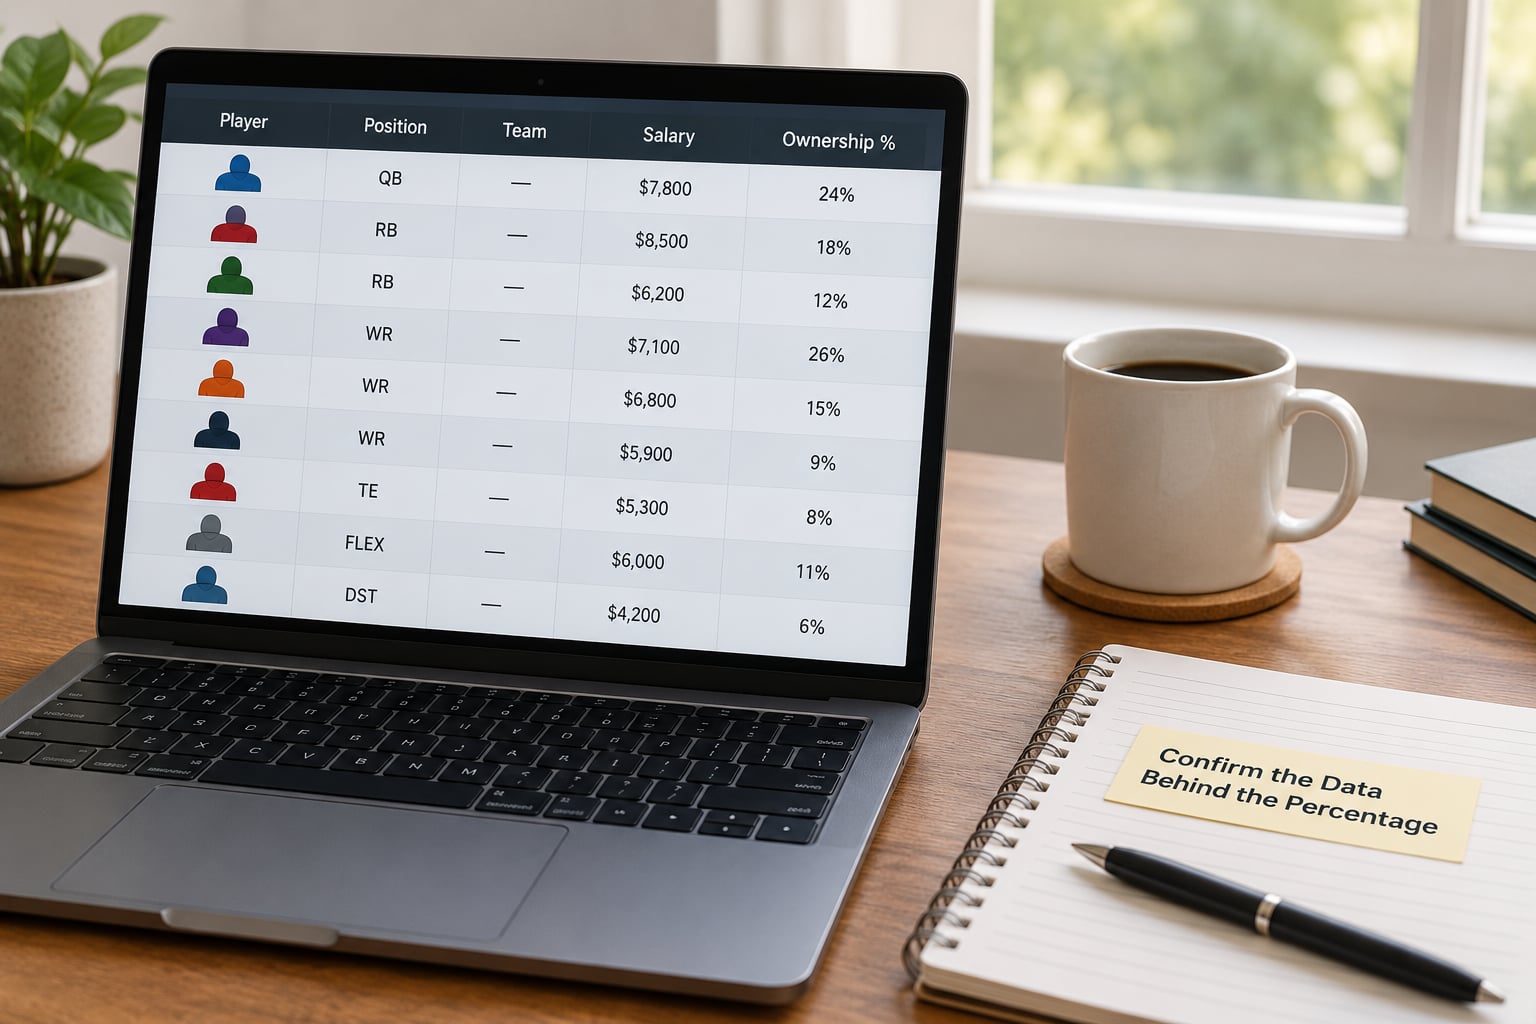
Start by asking where the number came from and what it was measured against. You want five things: field size, contest format, scoring settings, roster construction, and the time of the last update.
Field size alone can move a percentage by double digits. A player at 18% projected ownership in a 5,000-entry contest is being selected by roughly 900 lineups. The same 18% in a 100,000-entry contest is nearly 18,000 lineups. In the small contest, that player is probably a perfectly reasonable cash target. In the large one, they are chalk, and anyone with the same idea shares it with tens of thousands of rivals.
Player identity matters just as much. The same athlete can carry very different ownership on DraftKings and FanDuel because the salaries are different and the optimal build around them is different. Match the player, the site and the setting before you compare anything. If a tool lists a player by a slightly different name than your lineup tool, verify the match by position and salary rather than trusting the label.
Separate Projected Points from DFS Value
Projected ownership does not tell you what a player will score. It tells you how often a player gets picked. Those are different numbers, and reading them as one is what leads people to roster a low-owned tight end who never touches the end zone.
Evaluate four inputs on their own: projected fantasy points, salary, positional requirement and ownership. Then combine them.
Here is the shape of a real decision. Suppose your stack leans on a quarterback you project for 21 points, and the highest-owned quarterback on that site projects for 23 points at a salary several hundred dollars higher. If the popular quarterback is at 45% ownership and the cheaper one is at 12%, the cheaper quarterback is not automatically a good pick. Check what else is available at that salary. If five quarterbacks project within two points of each other there, the 12% quarterback offers genuine separation at nearly the same production. If he is the only option left in his range, the 12% is just an accurate description of an empty seat.
The test is simple: is this player priced below what the field expects for that level of production? Low ownership on its own means nothing. Low ownership plus a workable salary plus a path to the points you need is a real difference.
Identify the Source of the Projection
Every ownership number comes from an assumption about other people. It helps to know which kind of assumption you are reading.
Some models weight expert picks heavily. If a well-known analyst has a strong take on a player, the algorithm boosts that player’s projected use, which pushes ownership higher. Others build strictly from salary-value relationships, volume projections and roster-fitting constraints, so a player rises purely because the math makes him a natural build at a certain salary. A third group leans on recent game logs, which means a player coming off a big performance can climb without much change to his underlying projection.
Pure popularity feeds into all of them, especially on DraftKings and FanDuel where site-level lineup data feeds back into the models. If a player is trending on social platforms, expect the projection to drift upward before the news resolves.
Read a number differently depending on its source. A percentage driven mostly by expert picks can move sharply when that expert changes his mind. A percentage driven by salary math is stickier, because the salaries and roster rules do not move. When two tools disagree by more than a few points on the same player and site, this is usually why.
You can also sanity-check a model without any historical data. Pick three players on the slate and ask why the tool thinks the field will use them. If the explanation rests on something you can see — a low salary against thin competition, a favorable matchup, a workhorse role on a team that runs the ball — the model is reasoning from something real. If you cannot reconstruct the logic in a sentence, treat the percentage as a rough guide and move on.
Judge Ownership Relative to Your Player Pool
There is no universal threshold. A level that is dangerous in one roster construction is unremarkable in another, so the correct comparison is against the alternatives available to you at that salary and position.
Position scarcity moves thresholds more than most beginners expect. At running back, a cheap option in a good matchup against a bad defense can be close to automatic, so mid-range ownership there is not worth fading. At tight end, the field often concentrates on two or three names, so anyone else at a similar salary can be genuinely contrarian. Quarterbacks with low projected scoring are treated the same way: because almost nobody wants them, a quarterback projected for 14 points at a low salary can still be the right GPP build while a quarterback projected for 24 will be picked by almost everyone.
Compare wide and narrow. In a large-field GPP with 100,000 entries, a lineup built around the 60% quarterback and the 70% running back is one of thousands you will share. In a 3-max tournament with 15,000 entries, that same build is a real choice, and the field is thin enough that correct player selection matters more than uniqueness. Ownership still matters there. It just punishes you less for sitting on obvious picks.
Salary tier shifts the target too. A 30% owned player in the $9,000 range signals that the field has run out of better options, and there is rarely a way around him. The same rate on a $5,500 player usually means several comparable alternatives exist and the field is simply concentrating on one of them.
Football is not the only sport where this matters. NBA daily fantasy ownership spreads thinner across a larger player pool, and the levers are usage rate, team totals and opponent defensive ratings rather than goal-line and red-zone work. MLB ownership clusters on the top hitters in high-total games and on pitchers in good matchups. The read process is identical across all three — same field check, same salary comparison, same question about whether a path to the points exists.
Check Late Updates and Real Contrarian Edge
Ownership is a moving target until lineup lock. Run one final pass a couple of hours before you enter.
Look at five things. Injury news changes both the projection and the field’s expectation of the projection. Usage trends from the last two games tell you whether a player is being schemed for or quietly losing work. Weather matters more for skill players than most people expect. Game scripts shift when a team is unexpectedly without its starter. And field size changes your read on every percentage, because the same slate plays very differently in a 5,000-entry contest and a 100,000-entry one.
The bigger question is whether your contrarian pick has a reason. Players on r/DFS_Sports frequently ask for consensus ownership estimates before news resolves, and the useful replies are always the same shape: a low-owned player only counts if there is a specific mechanism producing the points. A player who merely disagrees with the popular opinion is not a play. A player whose role, matchup and price all point the same way is an edge, and ownership is just the number that tells you how much of it you have already claimed.
Write your reasoning down when you build the lineup. If you cannot explain in one sentence why a player will out-produce what a 60% ownership rate implies, you are leaning on the number instead of the player.
Common Mistakes
These five show up every week, and each one has a straightforward fix.
Treating Projected Ownership as Certainty
Projected ownership is an estimate about human behaviour, and humans change their minds. Treat the number as a starting point with a wide error bar, not a fact. Before you build around it, ask what would have to happen for the real number to land far from the projection. Injury news you already know about usually does that. Nothing in particular usually does not.
Ignoring the Contest Type
A 50% owned running back is a problem in a large-field GPP and the best available choice in a cash game. Decide what kind of contest you are entering before you look at a single percentage. If you find yourself entering a double-up without checking ownership at all, that is fine. If you are entering a 100,000-entry tournament without checking it, that is the mistake.
Chasing Every Low-Owned Player
Contrarian does not mean inverted. A roster made entirely of low-owned players is not unique by accident, it is unique because it ignored projection and salary. Warning sign: three or more players at under 10% ownership with no shared mechanism between them. If the picks do not connect, you have swapped a chalk problem for a variance problem, and variance problems lose more often.
Comparing Percentages Across Field Sizes and Sites
An 18% figure from a small contest tells you almost nothing about a large one. Before you call a player chalk, check the field size on the screen and confirm you are looking at the site you are actually entering. A player can be heavily owned on DraftKings and a free square on FanDuel, and building both lineups from one site’s numbers is a quiet way to lose money on your second entry.
Using Ownership Without Salary and Projected Points
Ownership describes popularity, not value. A player can be 40% owned because he is genuinely the best combination of price and projection, in which case his ownership is telling you to roster him. Separating the inputs takes a few extra seconds and it is the difference between a calculated pivot and a guess.
Frequently Asked Questions
What is a good ownership percentage for a DFS contrarian play?
There is no universal number, because the useful range depends on position and salary tier. In practice, something in the 5% to 25% range in a large-field GPP gives you separation without leaving you without a path to the points you need. Tight ends and low-projected quarterbacks tolerate higher ownership than running backs, because the field concentrates on fewer names there. Always compare a player against the alternatives available at the same salary rather than against a fixed cut-off.
How are projected ownership percentages calculated?
Most models generate thousands of simulated lineups using the platform salary cap, roster construction rules and each player projected fantasy points, then count how often each player lands in the top-scoring simulations. That frequency becomes the projected ownership percentage. Some models add a layer for expert picks, recent game logs or pure site-level trending, which is why two tools can disagree on the same player and the same slate.
Should I fade players with ownership above 50%?
Only in a large-field tournament, and only when a comparable alternative exists at a similar salary. A 50% owned player is not automatically bad, because the field is often right about him. Look for a replacement with a similar projected ceiling and a different path to the points, then confirm that your alternative is not simply the second-most-owned player on the slate. In cash games and small-field contests, heavily owned players are usually the plays you want.
Is low projected ownership useful in cash games?
Rarely as a goal in itself. Cash games and double-ups reward beating a cash line, and the highest-owned high-floor plays are usually part of that line. A low-owned player is still worth considering when injuries or bad matchups have pushed his projection up, since the field often underreacts to news. But if you are picking low-owned players purely for the sake of being different, you are adding variance to a contest that punishes variance first.
Can I compare ownership percentages from different DFS sites?
Not directly. The same player can be owned at very different rates on DraftKings and FanDuel because salaries, scoring settings and roster construction differ, and each site draws a different pool of managers. What you can do is compare within a site, confirm the field size, and check the timestamp on the estimate. If you are entering both, build both lineups from each siteu0026rsquo;s own numbers rather than carrying one siteu0026rsquo;s chalk into the other.
Conclusion
Start here: name your contest type, then check that the ownership number you are looking at belongs to that field size, that site and that point in the week. Only after that does projected ownership belong in your decision, sitting next to projected points, salary and roster fit rather than above them.
If you take one habit from this, make it the re-check a couple of hours before lock. Ownership shifts with injuries, usage and trending, and most of the useful separation in a slate appears in that window. Ownership is one input among several. On its own it just tells you what everyone else is doing.