
Adjusting projections for your league settings means rescoring every player’s projected stat line with your league’s exact rules instead of the ones your projection source defaults to. You take the raw numbers — yards, receptions, touchdowns, first downs — run them through your own points values, then re-sort the list because a settings change reshuffles who matters. The first pass takes about an hour per league. After that it is twenty minutes a week, and it is the difference between rankings you can defend and rankings you borrowed.
None of this is advanced math. It is mostly discipline: change one rule at a time, keep the raw stat lines intact underneath, and write down why you moved a number. This guide walks through the full process for redraft, keeper, dynasty and auction leagues, plus the platform questions that come up when you try to do it.
Table of Contents
- What You Need
- A written copy of your league settings
- A projection source that exposes stat lines
- A spreadsheet
- Your league’s depth
- Step-by-Step: How to Adjust Projections for Your League Settings
- 1. Start with a neutral baseline projection
- 2. Adjust for scoring rules
- 3. Adjust for roster and lineup rules
- 4. Adjust for positional scarcity and league depth
- 5. Account for team context and offensive environment
- 6. Apply dynasty and keeper adjustments
- 7. Recheck projections before drafts and lineup decisions
- Common Mistakes
- Editing final points instead of rates and shares
- Pushing team shares over 100%
- Double-counting bonuses
- Forgetting roster minimums
- Trusting a ranking that no longer matches your league
- Assuming every platform does the same job
- Changing several variables at once
- Over-adjusting the edge cases
- Frequently Asked Questions
- How do I edit fantasy league settings?
- How are fantasy football projections calculated?
- Is 0.5 or 1 PPR better?
- Can you change fantasy league settings after a draft?
- What does 80% rost mean in fantasy?
- How do I convert standard scoring projections to PPR?
- Conclusion
What You Need
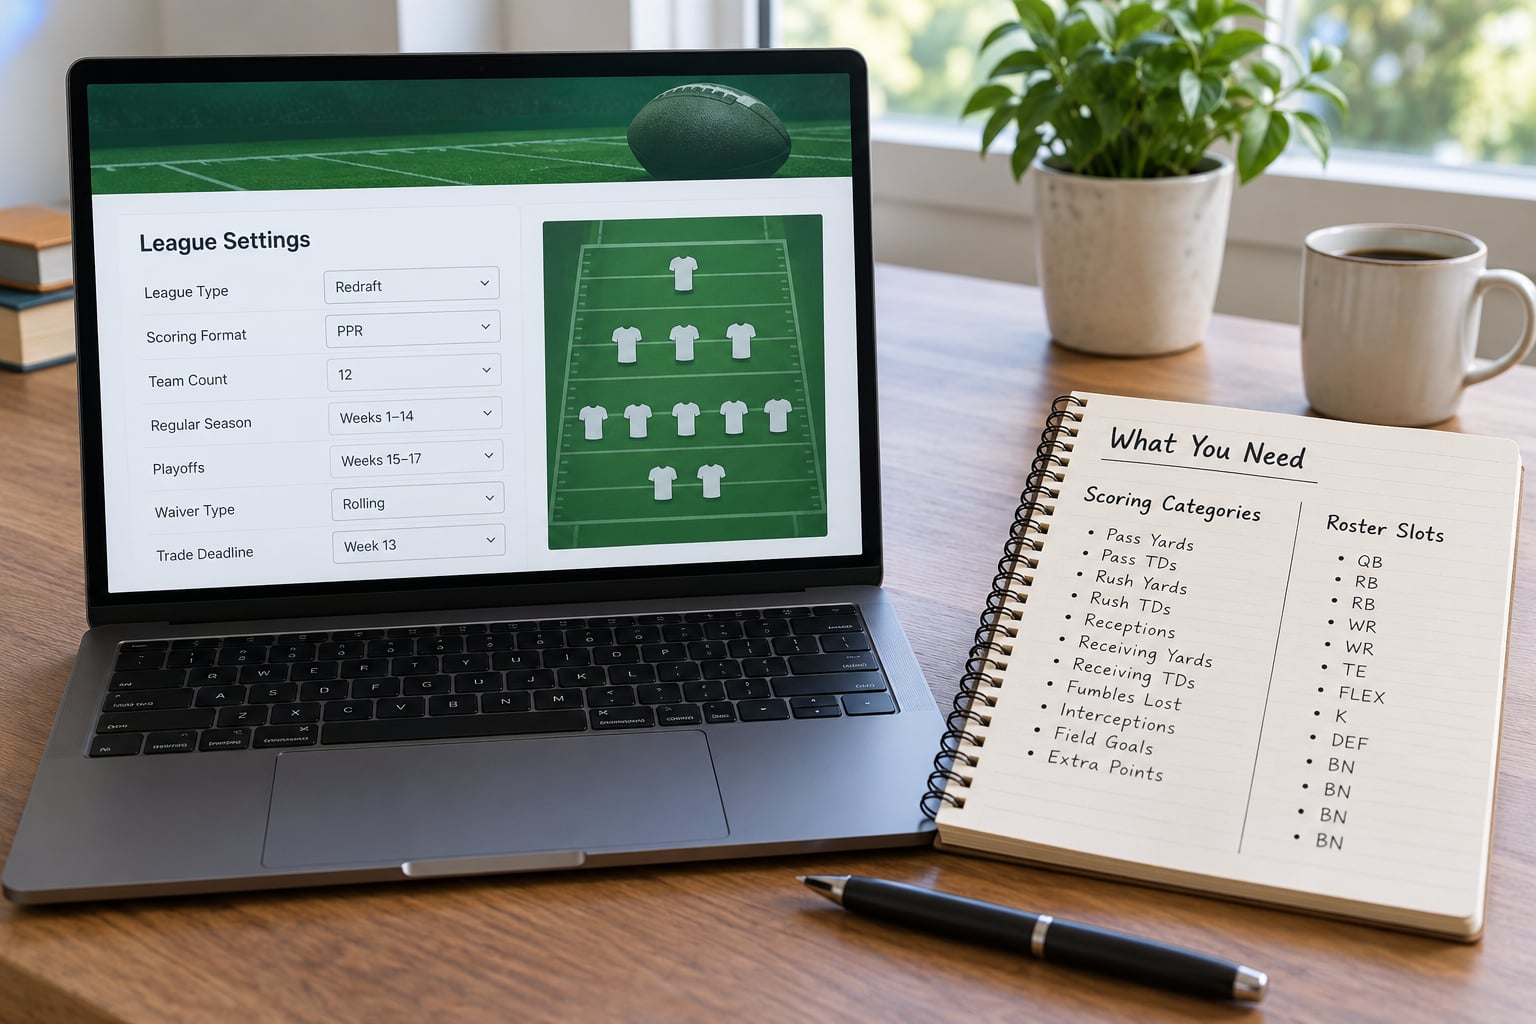
You need four things, and the first one is free.
A written copy of your league settings
Open your league’s settings page and write down the scoring values one line at a time: points per reception, per passing yard, per passing or rushing touchdown, the interception penalty, first-down scoring, and every bonus tier. Then list your roster: how many quarterback, running back, wide receiver, tight end, kicker and defensive slots, plus flex spots, IR slots and the minimum games played rule.
A projection source that exposes stat lines
You need a source that publishes projected rushing attempts, carries, targets, receptions, yards, touchdowns and interceptions — not just a ranking with a total attached. Razzball’s public projections list the stat lines it publishes per position, which is exactly the kind of export you want, and it openly states that custom points formats are not supported and that re-scoring is your job. Free and paid projection databases both work as long as you can get the components.
A spreadsheet
Google Sheets or Excel, either one. You need enough columns for the raw stats, your recalculated points, and one column per adjustment you make. A PivotTable or a sort that re-ranks automatically saves the most time.
Your league’s depth
Number of teams, number of starting lineup slots, and how many quarterbacks must be started each week. These three numbers set replacement level, and replacement level decides rankings more often than scoring does.
Step-by-Step: How to Adjust Projections for Your League Settings
1. Start with a neutral baseline projection
Pick one source and stay on it for the season. Mixing two projection models — one that regresses hard toward the mean, one that leans on last year’s yards — produces a list that ranks neither accurately. Record baseline projections for attempts, carries, rush yards, rush touchdowns, targets, receptions, receiving yards, receiving touchdowns, passing yards, passing touchdowns, interceptions and fumbles.
Keep those raw columns frozen. Everything after this point is a formula that reads from them. The moment you start typing new numbers into a projected-points column, the sheet stops being reproducible and you lose the ability to explain a ranking change.
2. Adjust for scoring rules
Your recalculated points column should be built as one formula per scoring category, not a single hand-edited total. Points per reception multiplies the receptions column. Passing yards multiply by your per-yard value. Add the touchdowns, subtract interceptions at your penalty.
This is the step most managers skip and it is where the biggest ranking shifts come from. A player projected for 55 receptions and 620 receiving yards looks ordinary in standard scoring and like a top-10 tight end at 1.0 PPR.
Here is a worked set of numbers for four players. Same underlying projections, four scoring systems.
| Player and projected stat line | Standard | 0.5 PPR | 1.0 PPR | Points per first down |
|---|---|---|---|---|
| QB: 4200 pass yds, 320 first downs, 35 pass TD, 7 INT, 4 rush TD, 45 receptions | 327 | 350 | 372 | 477 |
| RB: 250 carries, 1150 rush yds, 11 rush TD, 22 receptions, 210 rec yds, 1 rec TD | 126 | 137 | 148 | 202 |
| WR: 95 receptions, 1300 rec yds, 9 rec TD, 2 rush yds | 106 | 154 | 201 | 164 |
| TE: 55 receptions, 620 rec yds, 5 rec TD | 55 | 83 | 110 | 82 |
Scoring used: standard, 0.5 PPR and 1.0 PPR are one point per 25 yards, four points per passing touchdown, six per rushing or receiving touchdown, minus one per interception, with the reception bonus added in the PPR columns. Points per first down is one point per first down with no reception bonus, same yardage and touchdown values. Numbers are worked examples using a typical QB1, RB1, WR1 and TE1 projection, not real player forecasts.
Read the tight end row twice. Standard puts him outside the top 20 tight ends. Full PPR puts him near the top. If your league uses 1.0 PPR and you are drafting off a standard-consensus ranking, you are systematically undervaluing every pass-catcher who lives on volume rather than touchdowns.
Two categories need extra work. First downs require their own projection column, and most sources do not publish one, so you either estimate it from projected yards at roughly one first down per 10 to 13 yards of offense or you skip the category entirely. Bonuses — a 300-yard game, four touchdowns, a 100-yard rusher — need share math, because a bonus is triggered by volume that your raw projections do not split between players.
3. Adjust for roster and lineup rules
Scoring tells you what a point is worth. Roster rules tell you how many of them get collected. A receiver projected to score 154 points is worth drafting at 40 in standard because only twelve teams start a wide receiver and most drop him. He is worth a round-2 pick at 1.0 PPR where flex spots widen the pool of usable players.
Work through each of these:
- Starting lineup minimums. Every starting slot is a job. Every bench spot is a job you pay for but rarely cash in.
- Flex spots. A flex slot valued to a position raises that position’s floor and lowers the number of players who can go undrafted. Map each flex spot to the positions it covers before you value anything.
- Superflex and 2QB. These add quarterback jobs, which pushes replacement level deeper down the quarterback list and lifts every starter’s value.
- Minimum games. A roster minimum turns a projection into a two-part question: how many games does he play, and does he clear the threshold. Low-upside players with injury histories carry real risk in these formats.
- IR slots. More IR spots means fewer wasted roster positions, which raises the value of every healthy player.
- Kicker and defense requirements. A league that requires you to start a kicker means the kicker position is not optional, and the replacement line moves accordingly.
4. Adjust for positional scarcity and league depth
Value over replacement is projected points minus replacement points, and replacement points come from your starting slots and team count. That means step 4 is arithmetic, not opinion.
In a 12-team league with one starting quarterback, there are twelve quarterback jobs, so the replacement quarterback is roughly the thirteenth-best passer. In a superflex league, there are twelve more jobs, so replacement drops to the twenty-fifth-best passer and every starter above that line gains value. The same quarterback’s projected points never changed.
League size works the same way at every position. Ten teams means ten starting slots and a thin drop-off after the top ten. Fourteen teams means fourteen slots, a deeper bench, and less difference between the best and the replacement tight end. The practical effect on a ten-team league is a wider spread between elite tight ends and everyone else, and a bigger penalty for drafting depth at running back.
Calculate replacement level per position, subtract it from each player’s recalculated points, then sort. That is your league-specific ranking. If you run auction drafts, convert the sorted list to dollars with a fixed budget and league size; a $200 league with 12 teams gives you $2,500 to allocate across 12 rosters.
5. Account for team context and offensive environment
This is where hand adjustment earns its keep, and where it becomes guesswork. Keep it to changes you can point at, and put each one in its own column so you can undo it.
- Team passing volume. A quarterback on a team projected for 480 pass attempts has a different ceiling than one on a 340-attempt team, regardless of supporting cast.
- Rushing efficiency. Yards per carry and touchdowns per carry are the two rates that separate a runner on a good line from a runner surviving on volume.
- Offensive line quality. Adjusted line metrics move projection ceilings for running backs more reliably than almost anything else on the site.
- Coaching changes. A new offensive coordinator changes route trees and target distribution more than it changes a quarterback’s arm.
- Target competition. Check the target share column. A receiver’s share of his team’s targets is the number to move when a starter ahead of him is gone.
- Game script and schedule. Favorable opponents and expected negative defenses inflate undersized runners for a few weeks. Treat that as noise, not signal.
Write each change as a note in the row: “coach changed, route tree to under routes, targets minus 5%.” Notes cost nothing and they stop you from stacking three speculative edits on one player and calling it analysis.
6. Apply dynasty and keeper adjustments
Dynasty managers answer a different question. A 29-year-old running back projected for 260 points is worth less than that number implies, because the value sits in years you will never collect. A 22-year-old wide receiver projected for 200 points is worth more, because the curve is still climbing.
Blend production value with a multi-year range. Start with age-graded expectation rather than last year’s total, add contract status and years of control in an auction or salary cap league, then discount for injury history on a curve — a player who missed four games in each of the last two seasons is not projecting his career, he is projecting his floor.
A keeper is worth it when the player exceeds that line in your league’s scoring, not in a generic ranking. Apply the same age-curve range to every player on your board so you can see which names move and which stay put.
7. Recheck projections before drafts and lineup decisions
Projections are not a document you finish. Run a short validation routine every week: check injury news, re-read the depth chart, look at snap counts and target share trends, confirm the bye-week schedule, and refresh your one hand adjustment if a role actually changed.
Then write down which change was meaningful. A quarterback losing his first receiver to a trade is meaningful. A running back with 14 carries last week is not. The discipline is in the documentation — it stops you from chasing noise and rebuilding the sheet every Tuesday.
Common Mistakes
Editing final points instead of rates and shares
This is the mistake that breaks spreadsheets. If you overwrite a projected-points cell, the sort and the value-over-replacement formulas downstream read your typed number instead of the stat line, and the sheet silently stops agreeing with itself. Edit rates and shares — yards per carry, touchdowns per carry, rush share, target share — and let the points column recompute.
Pushing team shares over 100%
Shares of team rushes, targets and touchdowns have to total 100%. Raise one player’s target share and you must lower it somewhere else in the same column. Several popular spreadsheets carry a total-share check column for exactly this reason; if yours breaks, find the player whose share you edited without an offset.
Double-counting bonuses
If your scoring formula already includes a receiving touchdown at six points and you also add a “three touchdowns” bonus tier, you have not given the league a bonus, you have quietly made touchdowns worth more than your formula says. Add bonus columns as separate inputs, never as a second pass over the same event.
Forgetting roster minimums
A player projected for 40 points across 8 games can be worthless if your league requires 8 games played and he is a risk to miss one. Minimums sit in the roster settings, not the scoring settings, so they get missed. Check them before you rank.
Trusting a ranking that no longer matches your league
Consensus rankings are published for a standard league. Running one in a superflex or points-per-first-down league means every start/sit call, waiver bid and trade offer is made against the wrong ordering. If you do nothing else in this guide, do step 2 and step 4.
Assuming every platform does the same job
Some platforms re-score imported projections with your settings and sort by that number. Others publish only rankings, and some publish rankings whose underlying stat lines you cannot retrieve at all. Menu labels and available fields also change frequently, so check your platform’s current league settings screen rather than trusting a guide written two seasons ago — including this one.
Changing several variables at once
Change scoring first, look at the rankings, then change roster construction, then team context. When three edits land together you cannot tell which one produced a jump, and you will repeat the mistake every week.
Over-adjusting the edge cases
Waiver format, playoff structure, trade deadlines and whether scoring is median or highest-scorer do not change a single projection number. Median scoring changes how standings work, not how many points a player is projected to score. Save your time for the settings that actually move rankings: scoring, roster slots, league size and positional scarcity.
Frequently Asked Questions
How do I edit fantasy league settings?
Every major platform keeps scoring and roster settings on your league’s settings page, under a menu named something like Edit Settings or League Settings. Open it and note the scoring categories first, then the roster slots, flex positions and minimum games. If the platform re-scores projections with your settings, sort the player list by projected points instead of by rank. If it does not, export the raw stat lines and re-score them yourself in a spreadsheet.
How are fantasy football projections calculated?
Projections start with expected opportunity: snaps, carries, targets and goal-line touches. Those volumes get turned into yards using rates like yards per carry and yards per reception, then into touchdowns using team touchdown share and red-zone touches. Interceptions come from a turnover model. The raw stat lines are then multiplied by your league’s scoring values to produce projected fantasy points. Prediction markets and Vegas totals are often layered on top as a sanity check, which is why two projection sources can disagree on the same player.
Is 0.5 or 1 PPR better?
Neither is better in isolation; it depends on what you enjoy and what your league does to values. Half PPR keeps a small bonus for volume while standard scoring rewards only yards and touchdowns. Full PPR pushes receivers, running backs and tight ends up and quarterbacks down. Full PPR suits managers who like weekly lineup work and streaming from the waiver wire. Half PPR is a reasonable middle ground in a league with flex spots. Whichever you pick, convert projections into that format before ranking anyone.
Can you change fantasy league settings after a draft?
Most platforms let a commissioner change scoring, roster slots and league size mid-season, and some require a league-wide vote. Two things to check first: whether scoring changes apply retroactively to weeks already played, which would rewrite your standings, and whether roster minimums or games-played thresholds are recalculated. If your platform re-scores projections from imported stat lines, your custom settings start changing rankings immediately. Re-run the adjustment steps from this guide rather than continuing to draft from a standard list.
What does 80% rost mean in fantasy?
It means the player is rostered in 80 percent of the leagues on your platform, which marks him as a widely owned name rather than a league-specific pickup. Roster percentage matters most on the waiver wire: a player sitting at 90 percent rostered will be unavailable in a percentage-based league, while one at 80 percent is often still addable. In best ball and dynasty leagues the figure is mostly noise. Check it before you bid so you do not waste priority on a player who is already gone in half the league.
How do I convert standard scoring projections to PPR?
You do not convert the totals, you re-score the underlying receptions. Take the projected receptions column from your baseline source and add it to your points formula at 0.5 for half PPR or 1.0 for full PPR, leaving yards and touchdown values untouched. Never add a flat bonus to the finished points total, because that inflates players who catch few passes but score on volume. Recalculate, re-sort, then recompute replacement level since flex spots and scoring changes shift the positional order.
Conclusion
Adjusting projections for your league settings comes down to four moves: keep one source of raw stat lines frozen, re-score them with your scoring values, subtract a replacement level built from your starting slots and team count, and then layer on team context one documented change at a time. Start tonight by writing out your scoring and roster settings in full, because that page is what every later step depends on. Once the sheet exists, draft and start/sit decisions get a lot less arguable.