
How accurate are fantasy football projections? Useful but imprecise. A season-long auction projection is usually close on the total and often wrong on the order, while a weekly projection lands within 25% of the actual score in only about three of ten weeks and misses by more than half at least 42% of the time outside quarterbacks. Nobody is right every week.
I have run the same numbers more than once and the conclusion never moves: the number is an estimate of a probability, not a promise. Once you read a projection that way, it becomes genuinely useful instead of a thing you resent when it misses.
Table of Contents
- How Accurate Are Fantasy Football Projections?
- What Does Projection Accuracy Actually Mean?
- How Do You Measure Fantasy Football Projection Accuracy?
- How accurate are fantasy football projections by position?
- Why Do Fantasy Football Projections Miss?
- Which Factors Improve Projection Accuracy?
- Should You Trust Consensus Projections or Expert Rankings?
- How to Use Projections Without Making Costly Mistakes
- Frequently Asked Questions
- Are fantasy football projections accurate enough to start players?
- Which fantasy football positions have the most accurate projections?
- Why is my weekly fantasy projection different from consensus?
- How many games should I check before judging a projection model?
- Should I prefer consensus fantasy football projections or expert rankings?
- Is it better to start a player with a low projection or an uncertain one?
- Conclusion: Use Projections as Probabilities, Not Prophecies
How Accurate Are Fantasy Football Projections?
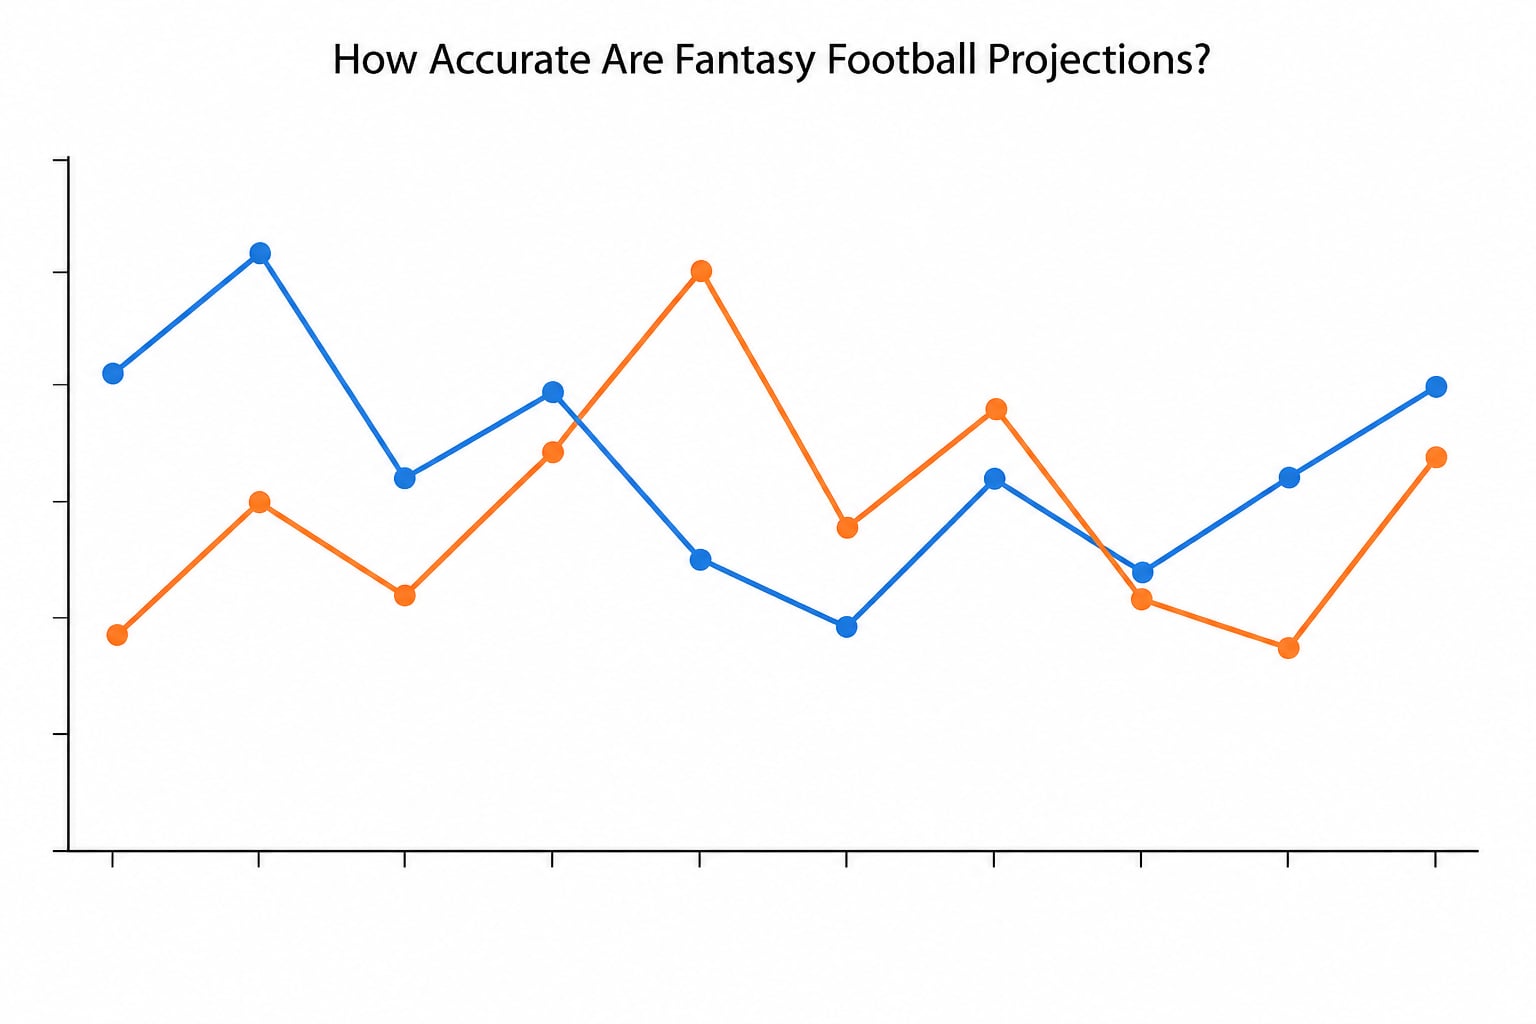
The short answer depends entirely on what you are measuring. Aggregate accuracy and rank accuracy are two different things, and almost every argument about projections on the internet is really an argument about which one the speaker means.
A five-week audit of Yahoo’s weekly projections published on the Baltimore Sports and Life forum is the cleanest self-run accuracy study still easy to find. Within 25% of the actual result happened in 30% of Weeks 1-2 and 28% of Weeks 3-5. Projections were off by more than 50% in either direction at least 42% of the time at every position except quarterback. They also skewed high: too high 55% of the time for tight ends, 59% for wide receivers, and 62% for running backs.
That study is old and small, so treat the percentages as a shape rather than a law. The pattern has held up in every audit since: quarterbacks are the most repeatable, and running backs and tight ends are the least.
Season-long projections behave differently. One Reddit manager audited their own draft-day team total and came out 2.12 fantasy points off across a full season, 1377.10 projected against 1379.22 actual. In the same thread a reply described projections landing 400 to 500 points away from reality. Both happened, and that is the point: a sum of twelve players can cancel out even when individual rankings invert.
Three things drive the practical value of any projection. The player, because volume makes performance repeatable. The format, because points-per-reception scoring rewards the receivers who are hardest to project. And the horizon, because a Week 1 projection has almost no season data behind it.
What Does Projection Accuracy Actually Mean?
A projection is a statistical estimate of expected fantasy points, produced by averaging historical performance with matchup, schedule and expected opportunity. When an app shows 14.2 points, that is not a guess. It is the expected value across many similar player-weeks.
Accuracy has four separate parts, and mixing them up is what causes arguments:
- Hit rate – how often the actual result fell inside a stated tolerance, such as within 25% of the projection. This is the number most often quoted, and it is the least useful alone because it hides how big the misses were.
- Average error – usually mean absolute error, which averages the size of every miss regardless of direction. It tells you how far off the model runs.
- Bias – whether errors lean one way. A model that is too high 62% of the time for running backs is not just noisy, it is systematically optimistic.
- Rank order – whether the players projected highest finish highest. This is the only measure that matters for start/sit calls and draft strategy.
Even a well-calibrated model misses because NFL outcomes contain randomness that no projection removes. Passes that should be completions get deflected. A kicker misses one field goal in a game decided by three points. Nobody’s model can price that.
Volatility is the other half of accuracy. Consistency is often measured as the coefficient of variation, which is the standard deviation of a stat divided by its mean. Lower means more repeatable. A quarterback with a 41% coefficient of variation on passing yards is far more projectable than a tight end at 70%, which is why you can trust a QB projection to a decimal place and cannot do the same with a boom-bust pass-catcher.
How Do You Measure Fantasy Football Projection Accuracy?
You can test your own source. It takes about twenty minutes a week for a season, and it is the only way to find out whether the projections you rely on are calibrated or just popular.
First, archive the projection before kickoff and do not let yourself edit it later. Write down each player’s projected fantasy points, then the actual points once the week ends. Match scoring exactly. A 6.4 reception projection means something different in a points-per-reception league than in standard scoring, so a mislabeled scoring setting invalidates the whole backtest.
Next, compute absolute error for every player: the projected number minus the actual number, stripped of its sign. That single column tells you more than any hit rate. Then check direction, and count how often the projection was above the actual result for that position.
Finally, give it time. A tight end who misses by 8 points in one week proves nothing. Sixty player-weeks per position is a reasonable minimum before you draw a conclusion, and you should judge the position, not the individual player, since one season of a particular player is mostly noise.
| Metric | What it reveals | Where it breaks down |
|---|---|---|
| Hit rate within a tolerance | How often the projection lands close | Hides the size of the misses |
| Mean absolute error | The typical distance of a miss | Same for over- and under-projections |
| Directional bias | Whether the model is systematically optimistic or pessimistic | Can look like noise in small samples |
| Coefficient of variation | How repeatable a stat is for that position | Describes the position, not the player |
| Rank correlation | Whether high projections really finish high | Collapses when everyone is bunched together |
The step people skip is the last one. If your source ranks players correctly season-long but cannot separate this week’s 12.3 from that week’s 11.9, it is accurate and still not useful for the decision on your bench.
How accurate are fantasy football projections by position?
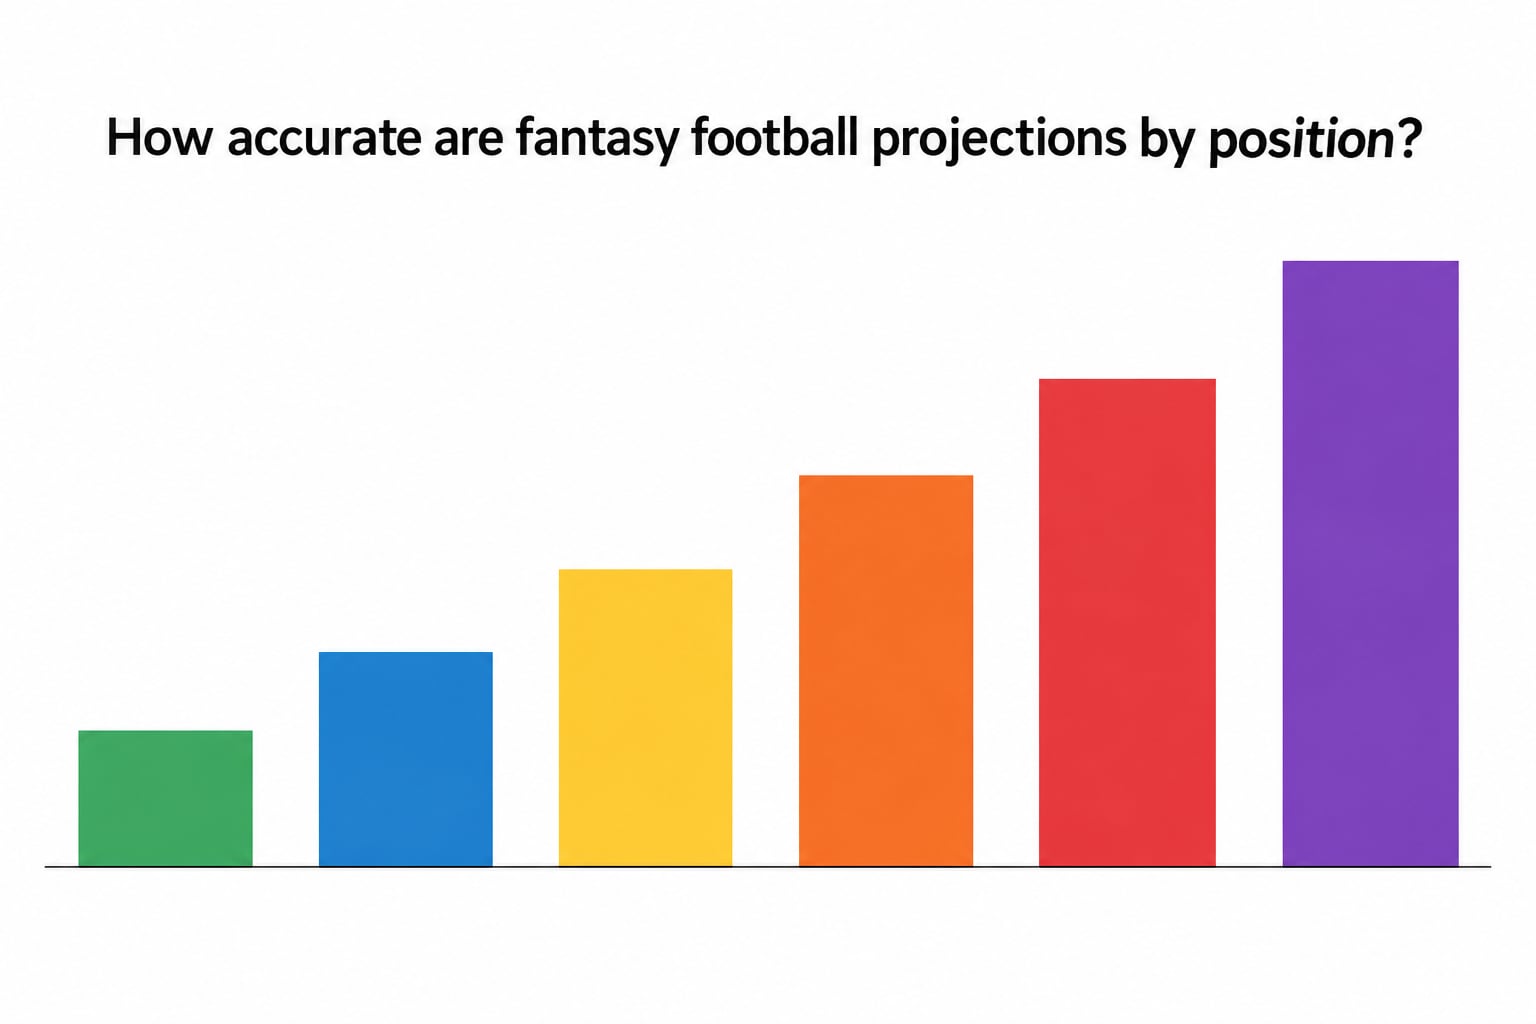
Accuracy follows opportunity almost exactly. The more touches a player is projected to get, the narrower the range of outcomes.
| Position | Typical coefficient of variation | What drives the swings |
|---|---|---|
| Quarterback | About 41% | Volume is high and scoring is predictable |
| Kicker | About 49% | Field goal range depends on game script |
| Wide receiver | About 61% | Target share swings with the quarterback |
| Running back | About 63% | Goal-line work and early exits |
| Tight end | About 70% | Red zone touches drive almost all upside |
| Defense/special teams | About 71% | Turnovers and return touchdowns are near-random |
These figures come from 4for4’s positional consistency research, and the pattern holds: the lower the coefficient, the more you can lean on the projection.
The stat-level version is even clearer. Targets are far more consistent than receiving yards, which are more consistent than touchdowns. One study put wide receiver targets at roughly a 41% coefficient of variation against about 151% for receiving touchdowns. Any model that projects volume well and touchdowns poorly is behaving normally, not failing.
This is also why points-per-reception leagues produce bigger projection errors. PPR scoring adds the one stat most tied to role rather than talent, and small changes in target share swing the number hard.
Why Do Fantasy Football Projections Miss?
Most misses are not model failures. They are events the projection was never given.
Injuries. A report at 11:00 a.m. on Sunday can erase a 15-point projection. Even in-season models only partly absorb this, and they absorb it more reliably for quarterbacks than for running backs, where a replacement back inherits a different role.
Uncertain playing time. A committee back projected as the starter can split carries 18-7 for reasons that only appear in the first quarter. Projections treat that committee as one player because no data exists yet for the combination.
Game script. A team projected to run 38 times throws 52 when they fall behind. That helps the defense and hurts the running back, in opposite directions, from the same event.
Scheme and role change. A new offensive coordinator can move a receiver from the slot to the outside line. Nothing in a season of history predicts it.
Opponent strength and venue. Two defenses can look identical on paper and produce very different weeks.
Weather and travel. Wind and cold suppress passing and rushing volume, most noticeably in the week where total passing yards drop by a fifth league-wide.
Stale data. Projections published before Sunday injury news, or before the final practice report, are operating on information that no longer exists. This is why the same site produces a great projection and a bad one on the same player.
Scoring mismatches. Importing a standard-scoring projection into a PPR league adds an unmeasured error on top of everything else.
Which Factors Improve Projection Accuracy?
Accuracy comes from information the model cannot guess, so the inputs that help most are the ones that pin down opportunity rather than talent.
Data volume. Three seasons of 16 games is a small sample for anything that varies year to year. That is why early-season numbers swing and why models regress a hot start toward the mean.
Expected opportunity. Snap share, target share, carries and red zone touches are the inputs that make projections land. Touch points beat talent ratings in almost every backtest.
Matchup data. Opponent-adjusted efficiency matters, including how a defense performs against the specific route trees and run directions a receiver uses. Vegas implied team totals carry real weight here because they aggregate scoring environment across the whole market.
Late injury updates. A projection you read on Tuesday and a projection you read Sunday night can differ by 40% for the same player.
Consensus blending. Averaging several independent sources reduces the influence of any one model’s quirks. As one FootballGuys poster put it, “If you do some type of blending you will get a nice average of them all, smoothing out the extremes.” That is variance reduction, and it is why consensus sheets usually beat their individual inputs.
Recent form belongs near the bottom of that list. Last week’s stat line describes one game. Three weeks of production says more about opportunity, and chasing hot hands is how managers talk themselves into 30-point receivers with 60% ownership.
Should You Trust Consensus Projections or Expert Rankings?
Trust consensus as a baseline and expert rankings as a filter, rather than picking one side of the argument.
Consensus projections are the average of many analysts and models. Their weakness is compression: the FootballGuys thread has a user counting 17 wide receivers inside two fantasy points, which makes the consensus sheet nearly useless for a start/sit call in the 8-14 point range. A FootballGuys user described having ten to fifteen receivers bunched that way and said it was “not helpful.” Consensus averages out extremes, and averaging works by removing the very information you need to separate two similar players.
Expert rankings come from one person’s model and judgment, so they spread wider and separate tiers better. The cost is that a single analyst can be wrong for a whole season. Published accuracy rankings have historically bounced around a lot for the same person year to year, which is a caution against building a season on one name.
Matchup research is the third input and the one that reacts fastest. Roster moves, coaching changes and scheme shifts show up in film and beat sheets before they show up in a season of data. Projections lag; matchup research leads.
The workable version is to set the lineup floor with consensus, use the floor and ceiling range to identify players whose upside exceeds their median, and let matchup research break the ties inside the cluster. Our weekly lineup picks on the site follow exactly that order.
How to Use Projections Without Making Costly Mistakes
Read the range, not the median. If a site publishes a floor and a ceiling, ignore the number in the middle for start/sit purposes. Two players with a 13.0 median can have very different ceilings, and the ceiling is what wins weeks.
Treat a 0.5-point difference as a coin flip. When projections cluster, the tie-break should come from matchup, role and opponent, not from whichever site you opened first.
Adjust for news, not for narrative. A promoted backup matters. A training-ground rumor that has not been reported does not. Give weight to information that changes expected touches.
Skip false precision. A 12.7 projection carries no more information than an 12.8 one. Nobody can defend the second decimal place.
Let a low projection be a reason to look, not an automatic value. A receiver projected at 8 points is usually projected at 8 points for a reason. Buy the dip when you see a matchup reason for the dip.
Backtest your own source before the season starts. Twenty minutes a week, written down, tells you more than any expert ranking chart, and it is the only one of these tips that compounds.
Frequently Asked Questions
Are fantasy football projections accurate enough to start players?
Yes, as a baseline rather than a verdict. Consensus projections reliably separate the top third of a position from the bottom third, and they narrow your pool to a short list. They are weakest where they are most needed, inside a cluster of similar players, so use the projection to set the range and break ties with matchup, role and opponent. In a weekly audit of Yahoo projections, roughly 30% of weekly results landed within 25% of the projection, which is accurate enough to inform a decision and not accurate enough to automate one.
Which fantasy football positions have the most accurate projections?
Quarterbacks, by a wide margin, followed by kickers. Coefficient of variation benchmarks put QB around 41% and kickers near 49%, against roughly 61% for wide receivers, 63% for running backs, 70% for tight ends and 71% for defenses. The reason is volume. Touch points and targets repeat from week to week, while touchdowns and turnovers, which drive most of the variance at tight end and defense, are close to random. Projections also get better for every position as the season supplies more games to learn from.
Why is my weekly fantasy projection different from consensus?
Usually because your source, your scoring settings, or your timing differs from the consensus sheet. A points-per-reception league can add two or three points to a receiver’s projection that a standard-scoring consensus sheet does not carry, and reading the sheet before Sunday injury news can leave you holding a stale number on a player who is now out. Different sites also blend different analysts, so small gaps on the same player are normal. When the gap is more than a couple of points, check scoring first, then check the timestamp.
How many games should I check before judging a projection model?
Aim for at least 60 player-weeks per position before drawing a conclusion, which means tracking a whole season across multiple players rather than following one player closely. Single games prove almost nothing at wide receiver or tight end, because a single stat line carries enormous variance. Judge the position, not the individual player, and check the direction of the errors as well as their size. A model that runs high on running backs is telling you something a hit rate alone would hide.
Should I prefer consensus fantasy football projections or expert rankings?
Start with consensus and use rankings as a filter. Consensus averages many analysts, which cuts the influence of any single model’s quirks, but it also compresses players into tight bands where 17 wide receivers can sit inside two fantasy points and the sheet becomes useless for a start/sit call. Expert rankings spread wider and separate tiers more cleanly, but one analyst can be wrong for a full season. The practical combination is consensus to set the range, rankings to break clusters, and matchup research to settle the ties.
Is it better to start a player with a low projection or an uncertain one?
Uncertain beats low, in most leagues. A low projection is the model’s honest expectation, and if the player gets the volume that number reflects, you will get a low return. Uncertainty usually means the model lacks information, such as a new quarterback’s target distribution, and that is exactly when the real outcome can exceed the median. Start the uncertain player at a discount, not the low projection by default. If two players project within a point of each other, take the one with the clearer matchup and the more stable role.
Conclusion: Use Projections as Probabilities, Not Prophecies
How accurate are fantasy football projections? Accurate enough to narrow your choices and to tell you which players deserve a look, and far too noisy to hand your season over. Accuracy rises with volume, falls with touchdowns, and never reaches the point where a single number should override matchup research.
Start with one thing this week. Photograph the projections of your whole roster before kickoff, and compare them with the actual scores on Monday. Do that for six weeks and you will know your own source better than any expert ranking will tell you, and you will never again confuse a median with a promise.