
A fantasy football tracking spreadsheet is a workbook you build yourself: one row per player, fixed columns for projections and actual fantasy points, so you own the data instead of renting it from a subscription site. Learning how to track your own fantasy football data in a spreadsheet takes about an hour to set up and fifteen minutes a week to keep it current.
The payoff shows up in the decisions that sites rarely let you adjust. You set your own projections, measure trade value against your league’s actual scoring, and keep a multi-season archive that no platform hands back to you.
Here is the short version of the build, and then the detail on each step.
- Pick one spreadsheet tool and commit to it for the season.
- Create five tabs, each with one job.
- Define the column headers once, and never rename them mid-season.
- Append a row per player per week instead of editing old rows.
- Add formulas for averages, deltas and start rate.
- Use filters and conditional formatting to read the sheet in seconds.
- Reconcile the points against your platform once a week.
Table of Contents
- What You Need
- Step-by-Step: Build Your Fantasy Football Tracker
- Set Up the Spreadsheet Structure
- Enter Weekly Player Data
- Add Formulas and Trend Metrics
- Review, Filter, and Use the Tracker
- Common Mistakes
- Frequently Asked Questions
- What is the best spreadsheet tool for tracking fantasy football data?
- Should I use Google Sheets or Excel for fantasy football tracking?
- How often should I update my fantasy football spreadsheet?
- What player statistics should I track for weekly lineups?
- Can I use a spreadsheet for both redraft and dynasty leagues?
- How do I avoid duplicate player records in my spreadsheet?
- Conclusion
What You Need
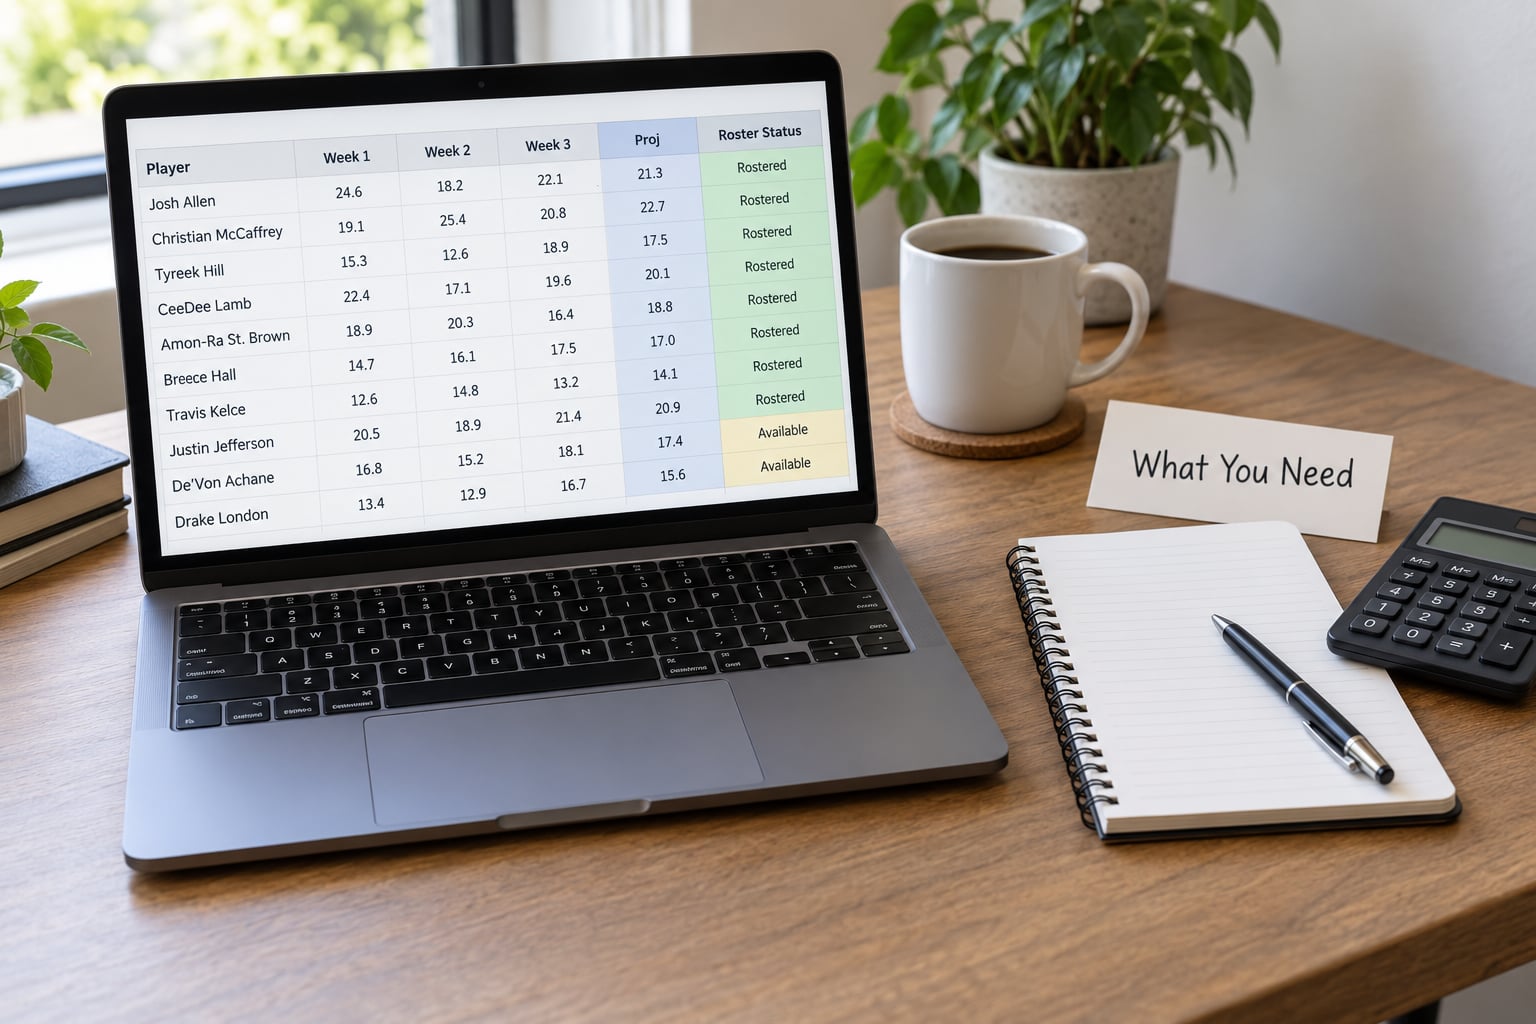
Six things, and none of them expensive. The spreadsheet itself is the easy part; the real work is deciding what counts as a record and what counts as a calculation.
- A spreadsheet tool. Google Sheets is the easiest for most managers because it runs in a browser, saves automatically, and shares with a link. Excel is better if you already know it, need heavy pivot tables, or want macros to pull data in on a schedule.
- One league data source. Pick a single source for weekly stats and stay with it, because mixing feeds is where duplicate and mismatched rows come from.
- A stable player identifier. Names break. Players share first names, suffixes change, accents get mangled. Use the platform’s player ID as the key and keep the name as a label beside it.
- Your league scoring settings, written down. Points per reception, bonus points for volume thresholds, whether interceptions are penalized, and the IDP scoring line. Your spreadsheet cannot be right if your math differs from the league’s.
- A handful of formulas. Six functions cover nearly everything:
AVERAGEIFS,SUMIFS,XLOOKUP,IFERROR,COUNTIFandQUERY. You do not need VBA. - Optional automation. A weekly CSV download you import, or an
IMPORTRANGEpull from a public sheet somebody else maintains. Both cut entry time; neither is required to start.
One caution before you go hunting for a feed. Bulk scraping a platform can breach its terms of service and get an account restricted. Manual entry, an official CSV export, or an API with a key and a rate limit is the safe road.
Step-by-Step: Build Your Fantasy Football Tracker
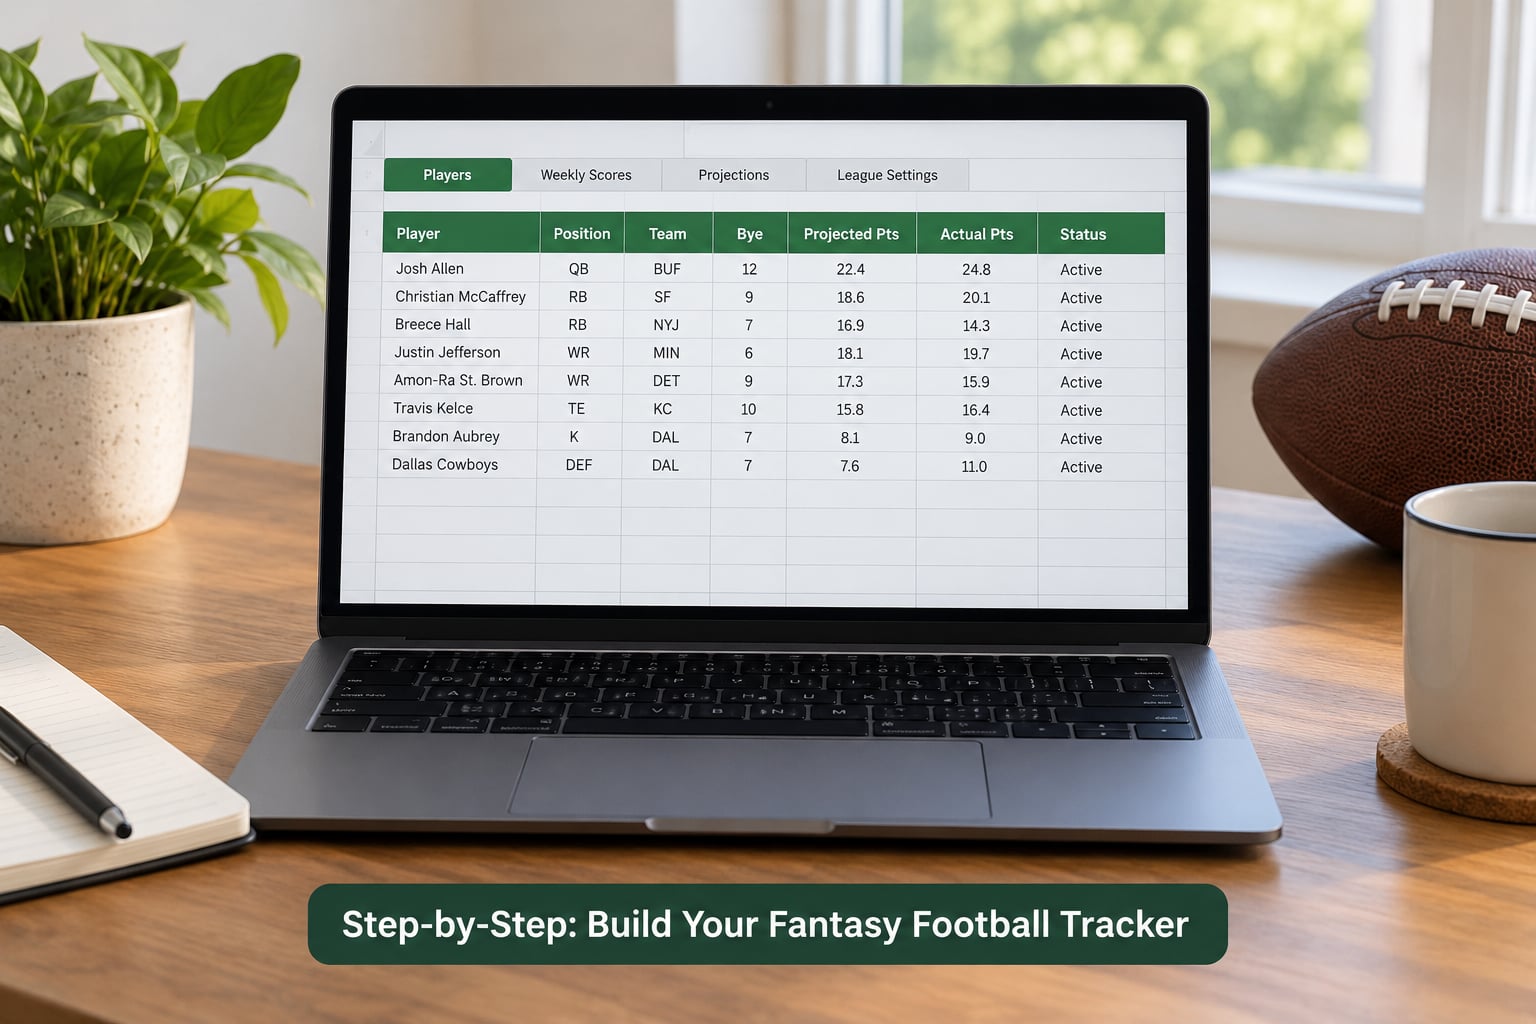
The build runs in eight moves: create the file, create the tabs, write the header row, paste the first week of data, add formulas, add formatting, add a dashboard, then reconcile. Here is each one with the detail and how you know it worked.
Set Up the Spreadsheet Structure
The rule that makes every fantasy football spreadsheet queryable is simple: one row per player per week. Break that rule and every formula downstream gets messy.
Split the workbook into tabs by job rather than by season. A workable layout has five tabs.
- Player Data one row per player, static attributes that rarely change: ID, name, position, team, draft slot, cost in an auction, ADP.
- Weekly Log one row per player per week, and the only tab you append to during the season.
- Lineups what you actually started each week, plus the matchup and your final score.
- Dashboard formulas only: weekly totals, start rate, points above projection.
- Helper hidden. Cross-reference columns and lookup lists live here so you can restructure without breaking formulas.
On the Weekly Log tab, freeze row one, then write these headers exactly. Copying this schema is faster than designing your own.
| Column | What it holds | Example |
|---|---|---|
| player_id | Stable key from the platform | nfl_3187 |
| player_name | Label for reading, never for matching | J. Taylor |
| week | Number only, no dates | 7 |
| projected_pts | Your projection before kickoff | 16.4 |
| actual_pts | Official scoring after the game | 23.1 |
| roster_status | Dropdown: Starter, Bench, IR, Out, DNP | Starter |
| note | Injury note or matchup context | Questionable, activated |
Add data validation to roster_status and week so typos cannot creep in. Format projected_pts and actual_pts as plain numbers with two decimals, never text, because a single apostrophe in front of a number silently breaks every average you compute later.
Keep raw data and calculations apart. The Weekly Log holds only what happened; the Dashboard holds only what you compute. When a formula looks wrong, you check two tabs, not one.
Enter Weekly Player Data
Entering weekly player data is the habit that decides whether the tracker survives contact with a real season. Append rows; never edit last week’s row to make this week look better.
On Sunday morning or Monday morning, work in this order. Pull the previous week’s box scores from one source, paste or type the points into new rows on the Weekly Log, fill in roster_status from what you actually started, and add a short note for anyone who missed time or faced a soft schedule.
That is fifteen minutes. On Tuesday, pull the new week’s projections into the projected_pts column for your roster and your two closest waiver candidates, not for all 1,500 players. The projection belongs on the row for that specific week, which is why one row per player per week beats a single “projection” column that you overwrite every week.
If you want to skip typing, use a CSV import from your data source and match its headers to yours in the import dialog. If a scraped file puts nothing in a column for a player who did not record a stat, that is normal; make sure the import writes a zero rather than leaving the cell blank, because blanks are excluded from averages and zeros are not.
Add Formulas and Trend Metrics
Formulas go on the Dashboard tab, pointing at the Weekly Log. Keeping them in one place means a broken reference is easy to find.
Average fantasy points per game for a player, ignoring weeks they did not play:
=AVERAGEIFS(Weekly_Log!F:F, Weekly_Log!A:A, $A2, Weekly_Log!G:G, "Starter")
Points above projection for one week, the number that tells you whether a hot streak is real:
=F3-E3
Start rate across the season:
=COUNTIFS(Weekly_Log!A:A, $A2, Weekly_Log!G:G, "Starter")/COUNTIF(Weekly_Log!A:A, $A2)
Total points scored for a player in a season:
=SUMIFS(Weekly_Log!F:F, Weekly_Log!A:A, $A2)
A live best available list while you draft, filtered to running backs you have not taken yet:
=QUERY(Player_Data!A:F, "select A, B, D where D = 'RB' and E < @now", 1)
Wrap anything that looks up a player in IFERROR, or a midseason pickup with no row yet will fill the column with #N/A.
Add a rolling average next to the season average and let the two lines diverge for a few weeks. A player averaging 14 points with a last-three-week average of 6 is a start/sit problem your eyes would have missed.
Review, Filter, and Use the Tracker
A tracker you never sort or filter is a file you never open. These four moves turn raw rows into decisions.
- Sort by points above projection to separate real breakouts from flukes.
- Filter
roster_statusto Bench and you have your waiver priority list, ranked by recent output rather than by who got mentioned on a podcast. - Conditional formatting does the reading for you: green fill when actual beats projection, red when it falls short, gray text on rows marked IR.
- A pivot table on the Weekly Log, with position as rows and week as columns, gives you points by position at a glance. It is the fastest way to notice a positional run or an empty running back tier.
Use it across formats too. Dynasty managers add age, draft capital and years of peak left to the Player Data tab, then rank prospects with the same SUMIFS you use for weekly points. Keeper leagues add a column of what each player cost you and a column of what a comparable player would cost, so the keeper math is arithmetic instead of memory. Auction managers add a budget column and subtract committed spend with one SUMIFS.
Common Mistakes
Most broken fantasy football spreadsheets fail for the same handful of reasons, and every one has a quick fix.
Matching on player names. “Marvin Jones”, “M. Jones Jr.” and “Marvin Jones Jr.” become three players, and your averages split three ways. Fix: match on player_id only, and treat the name as decoration.
Overwriting history. Pasting this week’s projections into the same column as last week’s actuals destroys the record. Fix: append a new row per player per week and never write above your last filled row.
Mixing scoring formats. A standard league and a PPR league share a player pool but not a point total. Fix: one workbook per scoring format, or a scoring multiplier column applied in the formula.
Trusting projections blindly. A projection is an assumption. Fix: track it beside the actual and measure your own accuracy with =AVERAGE(ABS(delta_column)). A 5.2 average error means you should discount that source by five points, and now you know that instead of guessing.
Deciding from too few weeks. Two good games is noise. Fix: set a rule in advance, like ignore the first four weeks, and require three starts before a player enters your waiver shortlist.
Ignoring error codes. #REF! means a deleted row or renamed column; #N/A means a lookup found nothing; a green triangle in the corner means a number is stored as text. Fix each at the source rather than hiding it with formatting.
Breaking IMPORTRANGE. The function fails when the source sheet is private, renamed, or larger than the function’s limit. Fix: ask for view access, keep the source under roughly 50,000 rows, and cache a copy of the data each week so a broken pull never loses history.
One more, and it is the one people regret: scraping a platform in bulk in violation of its terms. An account restriction costs you a season. A CSV export costs you five minutes.
Frequently Asked Questions
What is the best spreadsheet tool for tracking fantasy football data?
Google Sheets is the best starting point for most managers: it is free, runs in a browser, saves automatically, and shares by link. Excel wins if you already know it, work offline often, or want macros to pull data in on a schedule. Either tool works, as long as you pick one and keep the tab structure consistent.
Should I use Google Sheets or Excel for fantasy football tracking?
Use Google Sheets if you want free collaboration and no installation; its QUERY function builds a live best available list that Excel needs a pivot table or macro to match. Use Excel if you want offline access, heavier pivot tables, or VBA automation for a weekly import. The formula syntax differs, so the logic transfers but the exact functions do not.
How often should I update my fantasy football spreadsheet?
Twice a week is enough for most leagues. Enter last week’s actual points and roster status once, then enter this week’s projections for your roster and waiver targets before the waiver deadline. Most of the fifteen minutes goes on the first pass; the projection pass takes the rest.
What player statistics should I track for weekly lineups?
Track projected points, actual points, and roster status for every player you start or consider starting, plus a one-line note on injuries and matchups. Over a season, add snap share, target share and red zone touches to the Player Data tab, since those separate a fluke from a trend better than points alone.
Can I use a spreadsheet for both redraft and dynasty leagues?
Yes, and most managers keep separate workbooks because the questions differ. Redraft needs weekly points, projections and roster status; dynasty adds age, draft capital, contract years and career totals to judge trade value. The Weekly Log tab is identical in both, so you can copy it across rather than rebuild it.
How do I avoid duplicate player records in my spreadsheet?
Match on a stable player ID instead of the name, and keep the name as a label only. Set a data validation dropdown on roster status and week so typos cannot create near-duplicates. If a paste adds a row you already have, filter the player ID column for blanks rather than scanning names by eye.
Conclusion
Start smaller than feels satisfying. Create the Player Data and Weekly Log tabs, write the header row exactly as listed, and paste one week of results with real numbers. Once those records are clean and you have not overwritten anything, add the formulas and the dashboard. Fifteen minutes on Sunday is the whole ongoing commitment.
Once that habit holds, the questions you used to guess at — who is actually outperforming their price, who is a buy at this slot, what a trade is really worth on your scoring — start answering themselves.