Learning how to read a dynasty trade value chart comes down to four moves: confirm what the numbers measure, check how fresh they are, adjust them for your league, and then compare both sides of a trade. A chart is nothing more than a consensus ranking of players and future picks turned into a single relative number per asset, and that number is a starting point for negotiation, not a price tag.
It takes about ten minutes per trade once you have the routine down, and most of the work is judgment layered over arithmetic. Here is the process I use, including the parts the chart itself does not tell you.
Last updated: October 2026
Table of Contents
- What You Need
- Step-by-Step: How to Read a Dynasty Trade Value Chart
- 1. Identify the chart’s valuation scale and purpose
- 2. Check the chart’s time horizon and update date
- 3. Read each player’s rank, range, and trend
- 4. Adjust the value for league settings and roster construction
- 5. Compare the players involved in the trade
- 6. Test the trade against your league’s actual market
- Common Mistakes
- Frequently Asked Questions
- What does a dynasty trade value chart show?
- Are dynasty trade value charts the same as redraft rankings?
- Why do trade value charts disagree with my league?
- Should I trade a player because their chart value dropped?
- How much should I adjust a chart for a rebuilding team?
- How often should I check a dynasty trade value chart?
What You Need
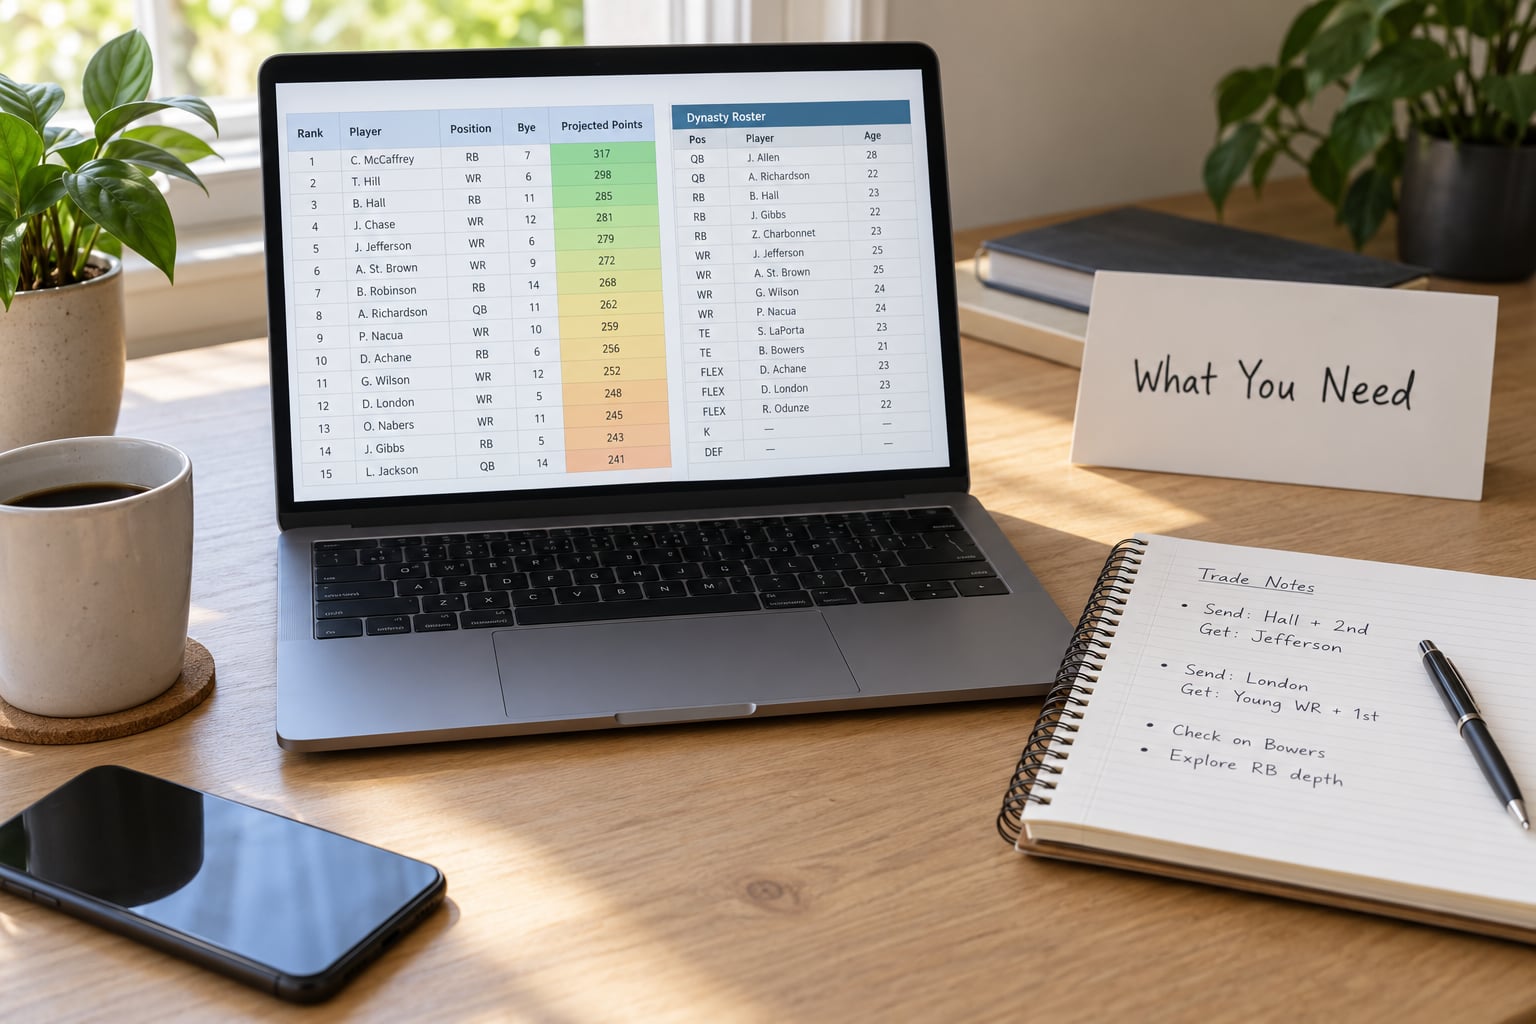
You need four things before a chart number means anything to you. Without them, you are comparing numbers produced for someone else’s league.
- A specific chart, not a general ranking. FantasyPros’ dynasty trade value chart is built from a consensus of expert dynasty rankings, which is a different animal from its weekly redraft consensus. Know which one you have open.
- Your league settings. Team count, roster size, starting slots, scoring format, keep-keeper rules and whether you play superflex or one quarterback.
- Player age and role context. A chart shows a current number. You have to overlay the age curve yourself.
- A record of your own market. Offers you received and deals you made over the past year, even rough notes.
The fourth one is what separates managers who win trades from managers who argue about them. A chart tells you the consensus view; your notes tell you what your league actually pays.
Step-by-Step: How to Read a Dynasty Trade Value Chart
1. Identify the chart’s valuation scale and purpose
First figure out whether the chart measures overall player value, trade value, dynasty value or auction value, because each one answers a different question. Consensus-based charts turn expert rankings into comparable numbers. Trade-value charts weight recent market activity more heavily. Auction charts value players for a specific league’s scoring and roster spots.
The scale itself matters less than you would think. A chart where the top player sits at 105 and another where the top sits at 82 are both internally consistent, and you only ever compare numbers from the same chart to the same chart. The community charts posted in r/DynastyFF commonly run on an ADP-first model with tier buckets from T1 down, where the author openly admits the approach loses some nuance.
If two numbers on the same chart disagree, the chart is telling you the market is split. That is information, not an error to argue with.
2. Check the chart’s time horizon and update date
Check whether the chart was built for one season or for a multi-year window. Short-term redraft rankings describe what happens this year, and a dynasty chart has to account for the next four to six. A running back who grades well for 2026 can sit far lower on a dynasty board if the model thinks his ceiling has already been reached.
Then look at the date. Static monthly charts go stale quickly in dynasty, because injuries, depth-chart changes and offseason moves move values without any change to the underlying talent. If the chart you are holding was published before a meaningful roster shakeup, treat every number on it as one revision behind.
Dynamic charts update weekly or better. If you are trading in August, the number you read in September probably supersedes it.
3. Read each player’s rank, range, and trend
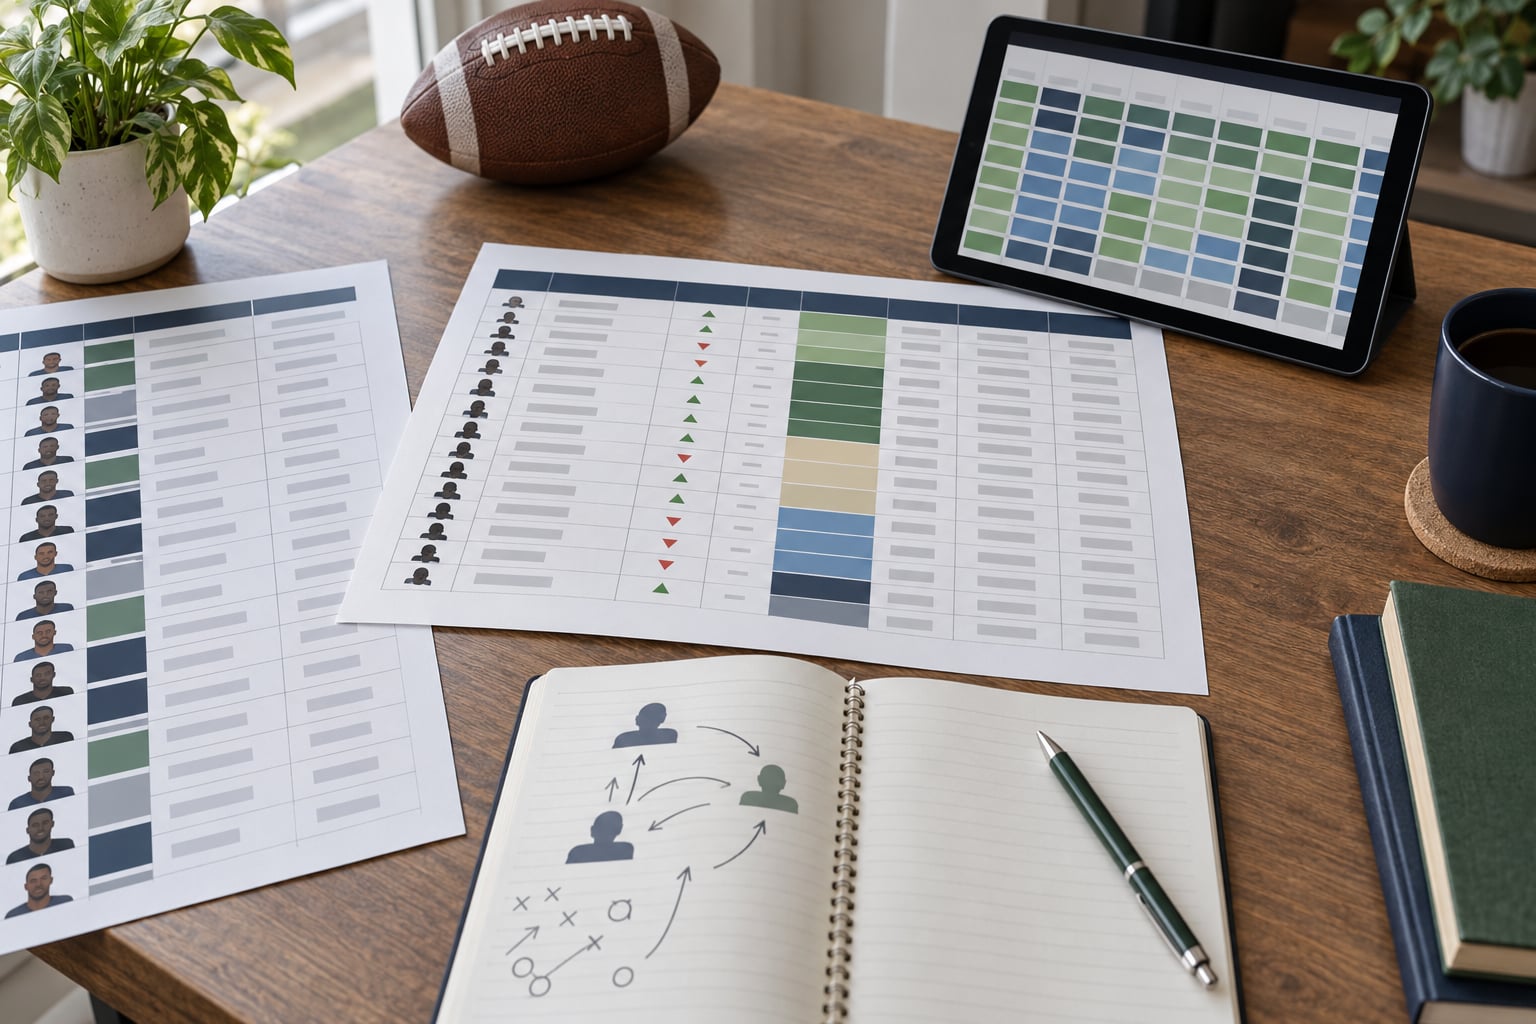
Most charts stack five or six columns, and beginners read only the first one. The others carry the real signal.
- Trade value is the raw comparable number. A score of 60 does not mean 60 fantasy points and it does not mean money. It means the model sees this player as worth slightly more than the next player down.
- Trend arrow shows movement since the last update. Rising value with steady production usually means a buy-low target. A falling arrow next to a healthy player often signals a temporary dip the market has not caught up to.
- Age is your discount rate. The chart bakes in some aging curve, but not the full effect of a position where the player loses steps faster.
- Positional rank tells you where he sits at his own position, which matters more than the overall number when you are short at one spot.
- Tier bucket groups players into bands. Tier membership is a rough equality test: two players in the same bucket are usually close to swappable, while adjacent buckets are rarely even.
Worked example: a second-year wide receiver valued at 58, trending up, sitting inside a strong tier bucket. Two more names carry 56 and 61. The 58 is not a steal because the gap is small; it is a swap. Value gaps only become trade currency once they exceed roughly five points.
4. Adjust the value for league settings and roster construction
This is the step most guides skip, and it is where a twenty-team 1QB PPR manager gets burned by a twelve-team superflex board. The chart you read was built on assumptions about roster construction, and your league rarely matches them.
| League setting | How it shifts values |
|---|---|
| Superflex versus 1QB | Quarterback value rises sharply, and backup quarterbacks with starting-caliber upside gain the most. The gap between QB1 and QB10 widens in superflex. |
| PPR scoring | Volume receivers gain; touchdown-dependent backs lose ground relative to standard scoring. |
| TE premium | Elite tight ends become top-10 assets instead of replacement-level fillers. |
| Twelve teams | Scarcity is compressed, so depth pieces hold more value than in a larger league. |
| Twenty teams | Replacement level rises. A mediocre starter with a starting job is worth much less than the consensus chart suggests. |
| Short roster, twelve to fifteen spots | Every roster spot has a price. A low-value veteran you must carry blocks someone better. |
| Keep-keeper rules | Young players already on your roster are worth more to you than the chart shows, because the alternative is a wasted season. |
| Taxi squads | Developmental players cost a slot but no risk. Value the slot, not just the player. |
Adjust in one direction only. If your league is superflex and the chart is 1QB, quarterbacks are worth more than the chart says, so add before you compare. If your league is twenty teams and the chart assumes twelve, discount the depth players on your side of the trade first, because that is the side most likely to be overvalued.
5. Compare the players involved in the trade
Now run the arithmetic. Add your side, add their side, compare the totals. Then apply the trade tax, which is the extra value you give up to acquire a stud in a package deal.
| Package | Reasonable overpay versus the chart totals |
|---|---|
| One player for one player | Near zero. A gap under five points is noise. |
| Two players for one stud | Roughly 15 to 25 percent. |
| Three players for one stud | Roughly 30 to 50 percent. |
Those percentages are rules of thumb drawn from how the community prices stacked deals, not laws. The reason they exist is simple: the league mate is absorbing concentration risk on one player while you spread yours across three. The premium is real, and asking for it is normal rather than insulting.
A concrete read: you send a 34, a 29 and a 24 against a 92. Your total is 87, which looks near even. Apply the tax for a three-for-one and the package needs to reach roughly 115 to 140 before it is a fair offer. Ask for it plainly and explain the range, and most managers understand.
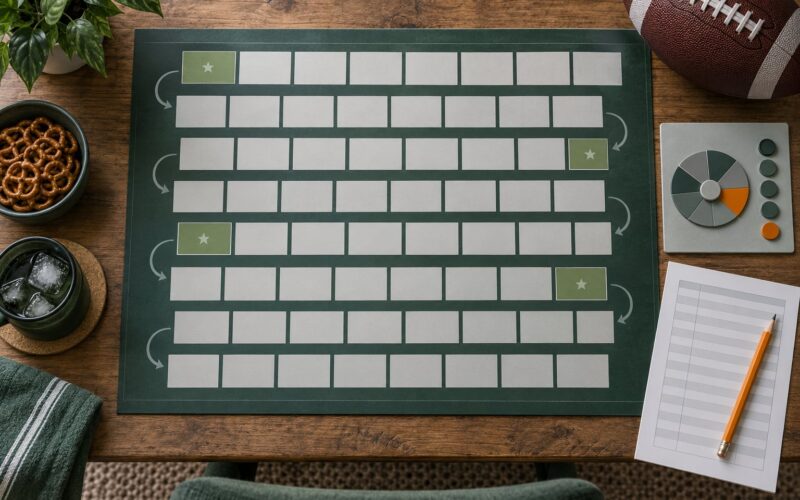
For draft picks, read the grid by row and column: the row is the round, the column is the overall pick inside it. Early picks are worth more in leagues with more teams and longer rebuild cycles, and less in twelve-team leagues competing to win now. When a chart lists picks at all, use its numbers rather than guessing from your gut.
6. Test the trade against your league’s actual market
The final step is checking the chart against reality in your specific league. Look at the offers other managers have sent you this month, and at the deals that actually completed. Your league has its own prices, and the consensus chart only knows the average across everyone else’s.
Three signals tell you the chart is off for your league. A player you have been offered twice with no follow-up is priced higher locally than the chart says. A player nobody in your league will take is priced lower. And a pick your league treats as junk may be undervalued by a chart built on larger league averages.
Cross-check a second source before you send anything, and never treat a chart as the final word. KeepTradeCut and the major experts’ consensus boards disagree often enough that the gap itself is useful information.
Common Mistakes
Most bad trades come from misusing a good tool. These are the mistakes I see repeated, with the fix attached to each.
- Reading the number as fantasy points. A score of 60 is a ranking position, not a projection. Fix: only compare numbers from one chart at one moment.
- Ignoring the trend column. A value that fell three points after one bad game is often the cheapest asset on your roster. Fix: look at movement across two or three updates before acting.
- Sending three players for one without the tax. Even totals get rejected because they underprice concentration risk. Fix: add 30 to 50 percent on a three-for-one.
- Trading in a rebuild year by chart value alone. A twenty-five-year-old running back may be your best asset and your chart’s fifteenth-best. Fix: rank your own board against your own window, not against the league’s.
- Using a chart built for a different format. A 1QB board in a superflex league badly undervalues quarterbacks. Fix: match the format first, adjust second.
- Valuing a player without a roster spot. A low-grade veteran still occupies a slot. Fix: price the slot in short-roster leagues.
- Treating the chart as the manager’s opinion. Numbers do not win trades, framing does. Fix: lead with positional need and roster construction rather than arithmetic.
Three habits keep the chart honest. Recalculate rather than react, since one update is noise and three is a trend. Log every offer you send and receive, because that log becomes your personal chart within a season. And prefer moves that make sense even if your league mate never sees the numbers.
Frequently Asked Questions
What does a dynasty trade value chart show?
It shows one relative number per player and, on many charts, per future draft pick. The number represents expected multi-year fantasy value, derived from consensus rankings, projections or recent trade data. It is not fantasy points and not money. Use it to compare players against each other and to test whether a trade package is balanced.
Are dynasty trade value charts the same as redraft rankings?
No. Redraft rankings forecast a single upcoming season, so they favor older players near retirement on strong yearly numbers. Dynasty charts project several seasons out, so youth and role security carry more weight. A player ranked eleventh for this year can sit third on a dynasty chart because of the years after this year.
Why do trade value charts disagree with my league?
Charts are built on assumptions about team count, roster size, scoring and starting slots. A chart built for twelve-team superflex will undervalue depth players in a twenty-team 1QB PPR league. Local demand also moves values away from consensus, especially for players nobody else wants. Both gaps are normal, and your own notes close them.
Should I trade a player because their chart value dropped?
Usually not on the drop alone. A fall after one bad game is often noise, and it is the moment to buy rather than sell. Check whether the trend has moved across two or three updates and whether anything real changed, such as a lost job or an injury. Sustained decline in role matters; a single dip usually does not.
How much should I adjust a chart for a rebuilding team?
Adjust upward for youth and draft capital, since both gain value over a multi-year window, and downward for veterans blocking a roster spot. Rebuilding managers should also value picks from later rounds higher than a twelve-team chart suggests, because there is no reason to compete for a good player now. Contenders should do nearly the reverse.
How often should I check a dynasty trade value chart?
Weekly during the season, and after any event that changes a role: an injury, a signing, a depth-chart shuffle or a coaching change. In the offseason, monthly is enough. Values move in bursts rather than smoothly, so daily checking adds noise. Pair the chart with a log of your own league offers, which moves far less often and matters more.
Start with one player on your roster whose chart trend has moved twice in the same direction, pull that number plus a second source, adjust for your league settings, and see whether it lines up with the last two offers you received. That single exercise takes ten minutes and is usually enough to show you where your league disagrees with the consensus.