
Projections come from an estimate of how many fantasy points a player will produce, built by feeding historical stats, offensive role, depth chart position and betting market expectations into a model, then converting the predicted volume and efficiency into points for your scoring format. That is the whole idea in one sentence. Updated for October 2026, this guide walks through each step so you can read a projection and know what it is actually telling you.
A projection is not a promise. It is a modeled expectation with a range of outcomes around it, and once you understand what goes into the number, you can tell the difference between a projection built on real volume and one built on last year’s inflated stat line.
Most managers never need to build their own model. What they need is a working vocabulary: why two reputable sites disagree about the same player, why kicker projections have decimals, and why a weekly projection can swing six points on a Tuesday without anything real changing.
Table of Contents
- What Data Goes Into Fantasy Football Projections?
- How Fantasy Football Projections Are Built, Step by Step
- How fantasy football projections turn team volume into player shares
- A worked example: projecting one wide receiver end to end
- How Do Player Roles and Team Context Change Projections?
- How Are Matchups and Schedules Factored In?
- What Role Do Market-Based Projections Play?
- How Do Projection Models Handle Uncertainty?
- Ceiling, floor and bust probability as player archetypes
- How Accurate Are Fantasy Football Projections?
- How to Use Fantasy Football Projections for Draft and Lineup Decisions
- Frequently Asked Questions
- Can AI predict fantasy football?
- How do fantasy football projections handle injuries?
- Why do kicker and defense projections show decimal points?
- Should I draft from ADP or projection rankings?
- Why do my fantasy football projections change every week?
- Conclusion
What Data Goes Into Fantasy Football Projections?
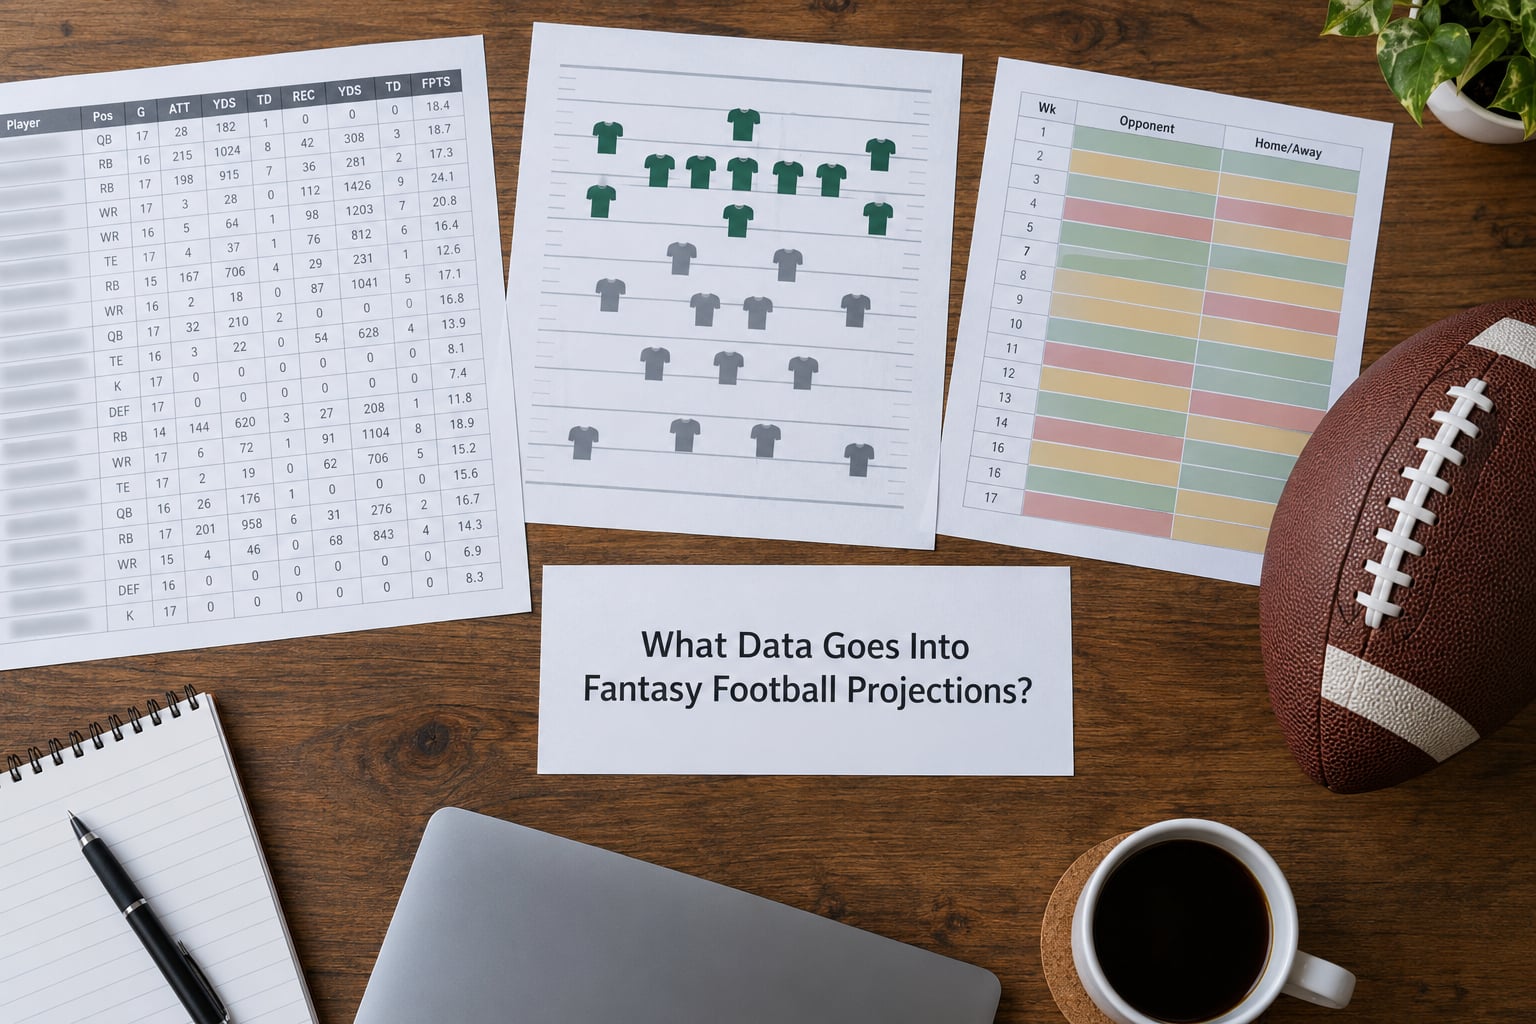
Every projection system starts by defining a projection: a statistical estimate of the fantasy points a player will score over a season or across a single week. The inputs fall into a few families, and good systems use all of them rather than leaning on one.
| Data type | What it measures | Why it matters to projections |
|---|---|---|
| Historical game and weekly stats | Yards, touchdowns, receptions, targets, carries, snaps | Sets the baseline before any adjustment is applied |
| Snap and playing-time data | Share of team snaps, offensive snaps per game | Volume is the single biggest driver of fantasy ceiling |
| Targets and touches | Target share, red zone targets, carries per game | Separates players who get the ball from players who are listed but idle |
| Player tracking data | Air yards, average depth of target, yards after catch, separation | Adds detail box scores cannot show, especially for route trees |
| Team context | Offensive line quality, pace of play, coaching staff, offensive scheme | Explains why a role may be about to grow or shrink |
| Injury and availability reports | Injury-adjusted games played, practice status | Turns a per-game projection into a season total |
| Schedule and opponent strength | Opponent defensive ratings, divisional games, byes | Adjusts the weekly number and the strength-of-schedule field |
| Betting market data | Over/under totals, point spreads, player props, implied team totals | Independent, continuously updated expectation of expected scoring |
Sample size matters as much as the data itself. A player with one good season has a small sample, and models weight small samples more cautiously than a player with three years of steady production.
Age curves enter here too, because a model that assumes a running back’s workload stays flat forever will eventually be wrong. Most systems build an age adjustment into the baseline before projecting volume forward.
How Fantasy Football Projections Are Built, Step by Step
Here is how fantasy football projections are made, in the order the work actually happens. Volume comes first, then shares, then efficiency, then points.
- Project team play volume. The model estimates how many offensive plays each team will run, based on pace, game script expectations and typical scoring margins.
- Split plays into pass and rush. Pass rate or pass ratio is projected, giving each team a total number of passing attempts and carries.
- Convert the market into implied team totals. A common shortcut is (over/under total divided by 2) minus (point spread divided by 2), which gives the points one team is expected to score.
- Allocate volume to players as market share. Target share, carry share and red zone share divide the team volume among individuals.
- Apply efficiency rates. Yards per target, yards per reception, yards per carry, catch rate and touchdown probability multiply volume into yards and scores.
- Adjust for regression to the mean. Extreme seasons are pulled back toward the player’s baseline, because no running back holds a 6.0 yards-per-carry for a decade.
- Convert to fantasy points for a scoring format. The same play produces different points in PPR and standard scoring.
- Output a range, not a single number. Ceiling, floor and bust probability come from the model’s error distribution.
Quarterbacks are often projected last as a residual of the other positions, since passing volume that does not go to receivers, tight ends or running backs has to land with the quarterback.
How fantasy football projections turn team volume into player shares
Imagine two teams that both pass 40 times per game. One throws 70 percent of its attempts to two receivers; the other spreads targets across the whole roster. Total team volume is identical, but the individual projections cannot be, which is why share assumptions carry so much weight.
Throwaway passes complicate this further. Roughly four to five percent of attempts are usually wasted on a receiver the quarterback was forced to dump to, and a model that ignores that overstates the primary target.
A worked example: projecting one wide receiver end to end
Suppose a wide receiver plays for a team projected to pass 600 times. If his target share is 24 percent, that is 144 targets. Apply a projected 8.1 yards per target and you get roughly 1,166 receiving yards.
At a 62 percent catch rate, 144 targets become about 89 receptions. Give him an 8 percent red zone share of team passing touchdowns, say 12 projected team passing touchdowns, and he lands near one touchdown per game at 8 percent, which is about 8-9 scores across the season.
In PPR scoring that projects to roughly 1,160 fantasy points. In standard scoring it lands near 1,330 once receptions and touchdowns are added. Same player, same underlying play forecast, two different fantasy totals. That is why a projection that ignores your scoring format is only half an answer.
How Do Player Roles and Team Context Change Projections?
Roles move more fantasy value than raw talent does. A third-string running back who never sees the end zone carries none of the goal-line work, so his red zone share collapses long before his yards-per-carry does.
Six factors most often shift a projection after the initial baseline:
- Depth chart position. A demotion to third string usually means a role reduction even without a stat change.
- Scheme and coaching change. A new offensive coordinator who prefers play action raises running back involvement for a quarterback who keeps the pocket.
- Offensive line quality. Run blocking grades and protection schemes drive both rushing volume and passing frequency.
- Team pace. Fast teams run more plays, which lifts nearly every offensive player in their building.
- Game script. Trailing teams pass more in the second half, and projections for late-season games assume a two-score margin in some models.
- Quarterback situation. A change at quarterback reshuffles target share more than it reshuffles team volume.
A practical example: a wide receiver who was a clear-cut third option loses a starting slot to a rookie drafted ahead of him. His team might project similar total passing attempts, but his target share drops from 24 percent to 17 percent, and the entire projection moves down with it. The change is in the role, not in the player.
How Are Matchups and Schedules Factored In?
Matchup adjustment adds or subtracts from a player’s baseline based on who is defending him. Opponents are graded on how many fantasy points they allow to each position, and sometimes on coverage-specific metrics like how often a corner concedes targets underneath.
Models also handle the softer schedule variables. Divisional games skew slightly toward one side, road games carry a small productivity penalty, and travel across time zones matters a bit more for running backs than for wide receivers, since a tired runner gets a smaller share of a team’s carries in a passing script.
Bye weeks are handled by spreading a season projection across the number of games actually played rather than assuming a full 17. Injury-adjusted games work the same way: a projection for 15 available games is lower than the same per-game number times 17.
Here is the important caveat. Strength of schedule in most systems adjusts expectations rather than predicting one specific game. A model is generally saying that this player faces weaker defenses on average than the league schedule implies, not that he will score 24 points against them on Sunday.
What Role Do Market-Based Projections Play?
Not all projection sites start from raw statistics. Some blend statistical models with betting market data, since sportsbooks adjust their numbers all week while most projection models recalculate on a schedule.
Other sources lean on expert judgment. An analyst sets a baseline from their own read of depth charts and coaching, then adjusts it, and their ranking is the final product rather than one input to a model. Aggregated or consensus sources sit in between: they collect many independent expert rankings and combine them.
Consensus reduces error for a simple reason. When several reasonable people with partially different assumptions converge on a similar rank, the noise tends to cancel out. The three common aggregation methods are a straight mean, a weighted average that gives stronger historical performers more say, and a robust or trimmed average that drops the highest and lowest ranks before averaging.
Market signals also show up as ADP, the average draft position across the fantasy world, and as auction values derived from those draft positions. Treat them as the market’s revealed opinion about a player, not as a measure of on-field production. A player goes in the first round every year because the market loves his ceiling, and that has almost nothing to do with his median projection.
How Do Projection Models Handle Uncertainty?
A serious projection is a distribution, not a point estimate. The model’s error is roughly symmetrical around the median for most players, which gives three useful outputs: a median projection, a ceiling and a floor.
The ceiling is what happens if the volume shows up and the efficiency lands at the high end. The floor is what happens when the bad splits compound for a season. Bust probability is the share of the distribution that falls below replacement level, and for a player averaging four fantasy points a game in a ten-team league, that number is not small.
Ceiling, floor and bust probability as player archetypes
The three numbers describe different risk shapes, and the shape tells you how to deploy a player.
| Archetype | What the range looks like | What has to happen to hit the top |
|---|---|---|
| Steady weekly producer | Narrow range, low ceiling | Nothing special, which is the point |
| Volume dependent | Moderate ceiling, moderate floor | Just earning the target share already on the sheet |
| Boom or bust | Wide range, meaningful bust probability | Both volume and a touchdown rate above his own baseline |
| Role dependent | Wide range before a deadline | Depth chart news going the right way |
A narrow range is a promise of boring, which is exactly what a low-scoring league rewards. A wide range punishes anyone who sets their lineup on Saturday morning and forgets the ceiling case existed.
This is why two players with identical median projections are not interchangeable. One needs only volume to deliver; the other needs volume plus a touchdown rate that has been above league average for years. When the second player falls short, he does not merely miss his median, he misses his floor too.
Projected rank is more reliable than projected points for the same reason. Rounding a hundred players to whole numbers changes little about their order, and small differences in point totals mostly disappear. A three-point gap between two receivers is noise. A thirty-point gap is a real separation.
How Accurate Are Fantasy Football Projections?
Useful ones, and less accurate than the number on your screen suggests. Fantasy projections are measured against a genuinely random outcome, so even a strong model leaves plenty of error behind.
Forum discussion on projection accuracy keeps returning to a useful expectation check: even the better expert rankings land around 60 to 65 percent correct on binary decisions where you ask which of two players will finish with more points. That is what good looks like. Anyone promising better is describing luck, not skill.
The accuracy metrics analysts use are worth knowing, mostly so you can read a methodology page without squinting.
| Metric | What it measures | Direction | Plain-English meaning |
|---|---|---|---|
| R-squared | Share of real-world variation a model explains | Higher is better | How much of the actual results the model anticipated |
| RMSE | Average size of the miss, in points | Lower is better | The honest version of how far off the model is |
| MAE | Average absolute miss, ignoring direction | Lower is better | Typical miss without outsized errors dominating |
| MAPE | Average miss as a percentage of the actual value | Lower is better | Relative accuracy, distorted near zero points |
| MASE | Error compared with a naive baseline | Below 1 is better | Whether the model beats simply predicting last year |
| sMAPE | Symmetric percentage error | Lower is better | Percentage error that treats over and under equally |
R-squared and RMSE are the two that tell you the most. R-squared answers how much of the movement the model catches. RMSE answers how many fantasy points it is typically wrong by, which is the number that matters for a start/sit decision.
Accuracy also varies by position and by horizon. Running backs are the least predictable group because their workload depends on game script and goal-line touches. Quarterbacks are usually the most stable on a season basis. Weekly projections are structurally noisier than season projections, because a single week’s projection inherits one game’s worth of variance plus the model’s normal error, and news keeps rewriting the input values all week.
Early-season projections are the least reliable of all. They are built on last year’s data, a depth chart that has not been tested, and an injury list that has not been finalized. By week four the model has real data for the current season. That is why a projection moving in October says more than a projection moving in August.
How to Use Fantasy Football Projections for Draft and Lineup Decisions
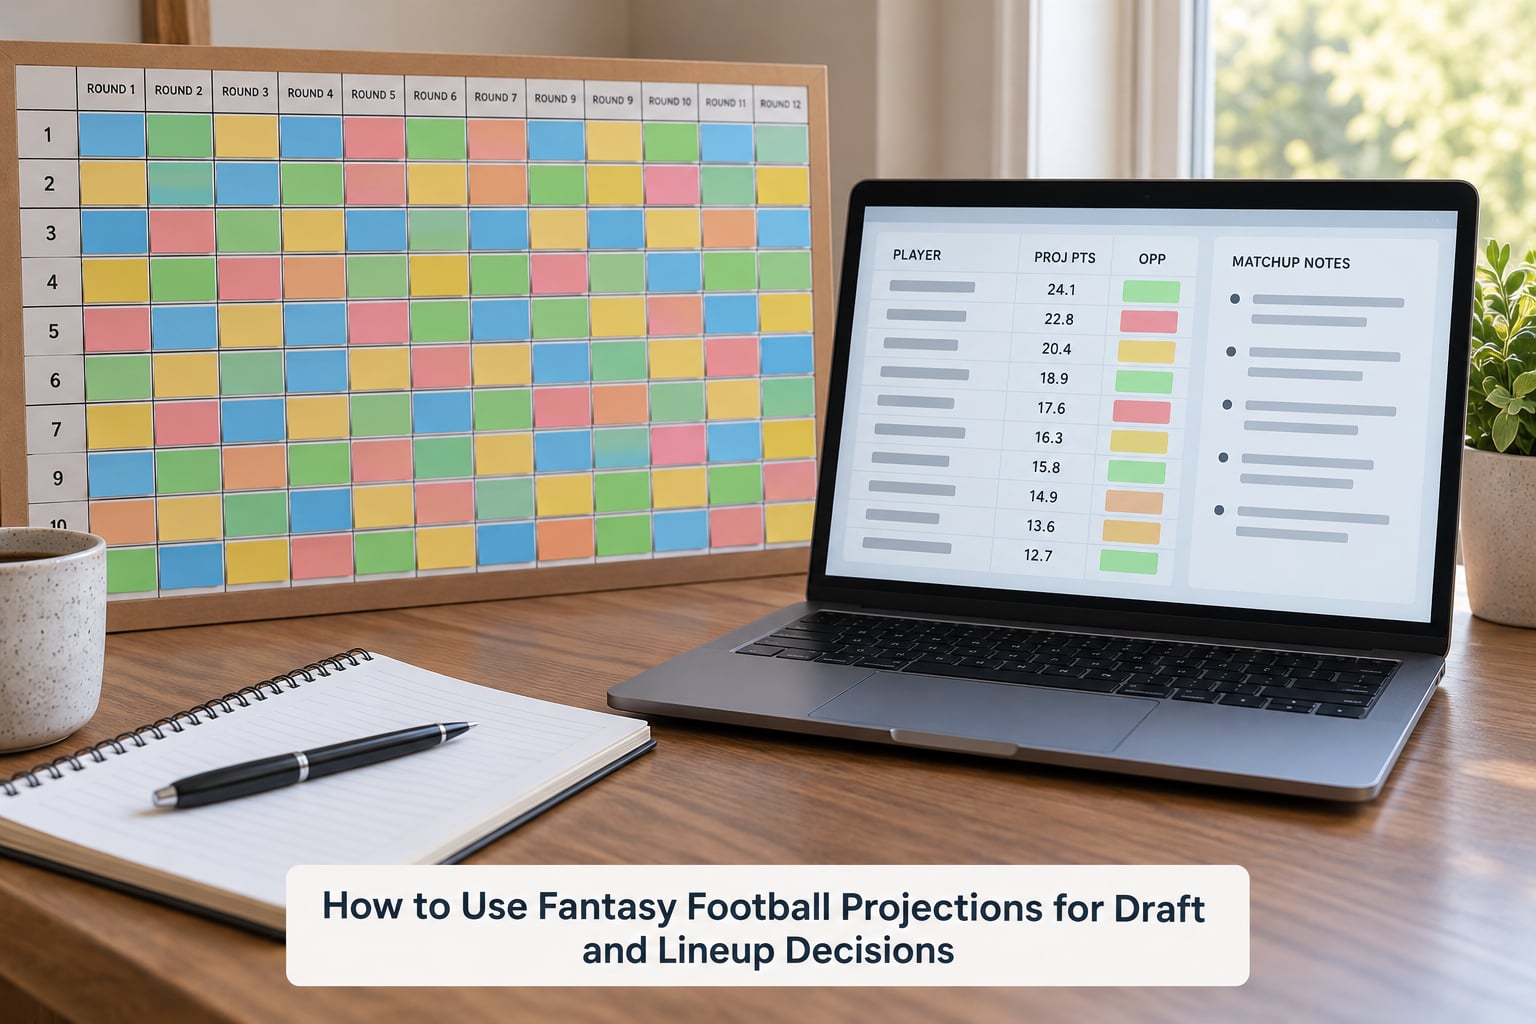
Projections are an input to a decision, not the decision. A few habits separate managers who get value out of them from managers who just follow a number.
- Use two or three sources, not one. Where reputable models disagree by a few points, they are saying the same thing. Big gaps are the interesting signal and usually come from different role assumptions.
- Read the range before the median. A player with a wide range fits a playoff roster; a player with a narrow range fits a consistent scoring league.
- Check the scoring format on every screen. If the number was not produced with your settings, it is not your projection.
- Weight volume over efficiency. Two yards per target with 200 targets beats eight yards per target with 40 targets far more often than the efficiency number suggests.
- Do not overreact to small gaps. When two players differ by a couple of projected points, pick on role, schedule, injury status and preference.
- Recalculate weekly with news. A depth chart change or a reported injury matters more to this week’s number than any seasonal adjustment.
ADP and projection rank answer different questions. ADP tells you what other managers are doing. Projection rank tells you what the models expect. In best ball drafts where you never set a lineup, following the market makes more sense because you are picking against other drafters. In seasonal leagues, the projection is the better guide.
One last habit is worth more than it sounds: when a projection surprises you, look for the assumption behind it rather than reaching for the next site. A receiver projected low on a team with a new quarterback is usually a volume question. A kicker projected high is usually a games-played and field-goal volume question. Nearly every surprise has a mechanism, and most mechanisms are findable in the inputs.
Frequently Asked Questions
Can AI predict fantasy football?
Machine learning models process far more variables than any human can hold, including player tracking data, coaching tendencies and thousands of games of history. They handle volume and efficiency forecasting well. What they cannot do is produce confidence where none exists, because injuries, game script and referee assignments stay unpredictable no matter how good the model is. A projection narrows the range of reasonable outcomes rather than removing it.
How do fantasy football projections handle injuries?
Models adjust in two ways. First, a season projection is multiplied by projected games played, so a player expected to miss three games gets a lower total even with identical per-game output. Second, injury reports update the volume split, so a backup who replaces a starter inherits that player’s target share. Accuracy drops sharply for players returning from a serious injury in the first weeks back, which is why those projections carry wider ranges.
Why do kicker and defense projections show decimal points?
Kicker and defense scoring depends on small, continuous quantities, chiefly field goals made and defensive fantasy points allowed per game. Expected points per game therefore produce a fractional average, so projections land around 8.6 points instead of a whole number. Skill player scoring is dominated by larger events, receptions and touchdowns, which cluster into integers. The decimals are a sign of a finer-grained estimate, not greater accuracy.
Should I draft from ADP or projection rankings?
Use ADP when you need to beat other drafters, such as in best ball leagues where you never manage a roster. Use projection ranks in seasonal formats, where the models are the better expectation of where value sits. If you want both, draft close to the consensus ADP at wide positions and push slightly on players whose projection rank sits well above their ADP, because that gap is where free value usually lives.
Why do my fantasy football projections change every week?
Weekly projections update because their inputs change. Depth charts shift, a receiver misses practice, a team adjusts its pass rate, or an opponent changes coverage personnel. Small input moves create visible output moves, especially for players whose projection leans on a thin sample. A change is not a mistake, but a large one usually signals a role change worth reacting to rather than a quiet recalculation worth panicking about.
Conclusion
A fantasy football projection is a modeled expectation built from play volume, market share, efficiency rates and regression, then translated into points for your scoring settings and published as a range. That is the whole machine, from team totals down to a kicker’s field goals.
Before you set a lineup or assign a draft value, take the player’s projection range and check it against role, schedule, injury status and the assumptions the model made. That four-point check is where most of the edge in a fantasy league actually lives.