Learning how to spot regression candidates in fantasy football comes down to one comparison: actual fantasy points against expected fantasy points. A player who keeps scoring fewer points than his chances create is a buy-low candidate. A player who keeps scoring more than his chances create is someone you sell before the gap closes. The process takes about 20 minutes a week once you know which numbers to pull.
The mistake most managers make is starting with the box score. Total yards and touchdowns tell you what happened, not what is repeatable. Underneath those totals sit target share, route participation, red-zone touches and expected points, and those are the numbers that stay stable when a schedule gets easier.
Table of Contents
- What You Need
- Step-by-Step: How to Spot Regression Candidates in Fantasy Football
- 1. Identify the Player’s Actual Role
- 2. Separate Bad Luck From a Real Trend
- 3. Check the Schedule and Team Environment
- 4. Compare Production With Advanced Trends
- 5. Set a Reasonable Ceiling and Buy-In Price
- Common Mistakes When Finding Regression Candidates
- Frequently Asked Questions
- What is regression in fantasy football?
- How long should I wait before buying a regression candidate?
- How do I tell regression apart from a genuine decline?
- Does last season’s production matter when identifying regression candidates?
- How do stat corrections work in fantasy football?
- What is the best way to find regression candidates on waivers?
- Conclusion
What You Need

None of this needs a paid subscription. What it needs is a consistent routine, because the value comes from comparing the same numbers for every player on your league every week rather than from any single lookup.
- An expected fantasy points model. Sharp Football Analysis and FantasyPoints both publish free xFP leaderboards you can sort by position and by week range. Pick one and stay with it, since the exact model differs and mixing them produces nonsense comparisons.
- Per-week participation data. Snap counts, route participation and target share by week, not season totals. A season average can hide a role that quietly disappeared in week 4.
- Touchdown and efficiency splits. Touchdown rate, yards per carry or yards per attempt, red-zone share and goal-line carries.
- Schedule detail for the next four to six weeks. Opponent defensive strength, divisional games and the bye week.
- Roster and coaching news. Quarterback changes, offensive coordinator departures, rookie starters and injury reports.
- Your league context. Scoring settings, roster construction and the trade deadline, because a four-point swing matters differently in a two-point league.
A notebook helps more than it sounds. I keep one page per player with the date, the role note and the one number I am betting on. When you revisit a name six weeks later, the note tells you whether your thesis was ever about opportunity or whether you drifted into chasing recent scoring.
Step-by-Step: How to Spot Regression Candidates in Fantasy Football
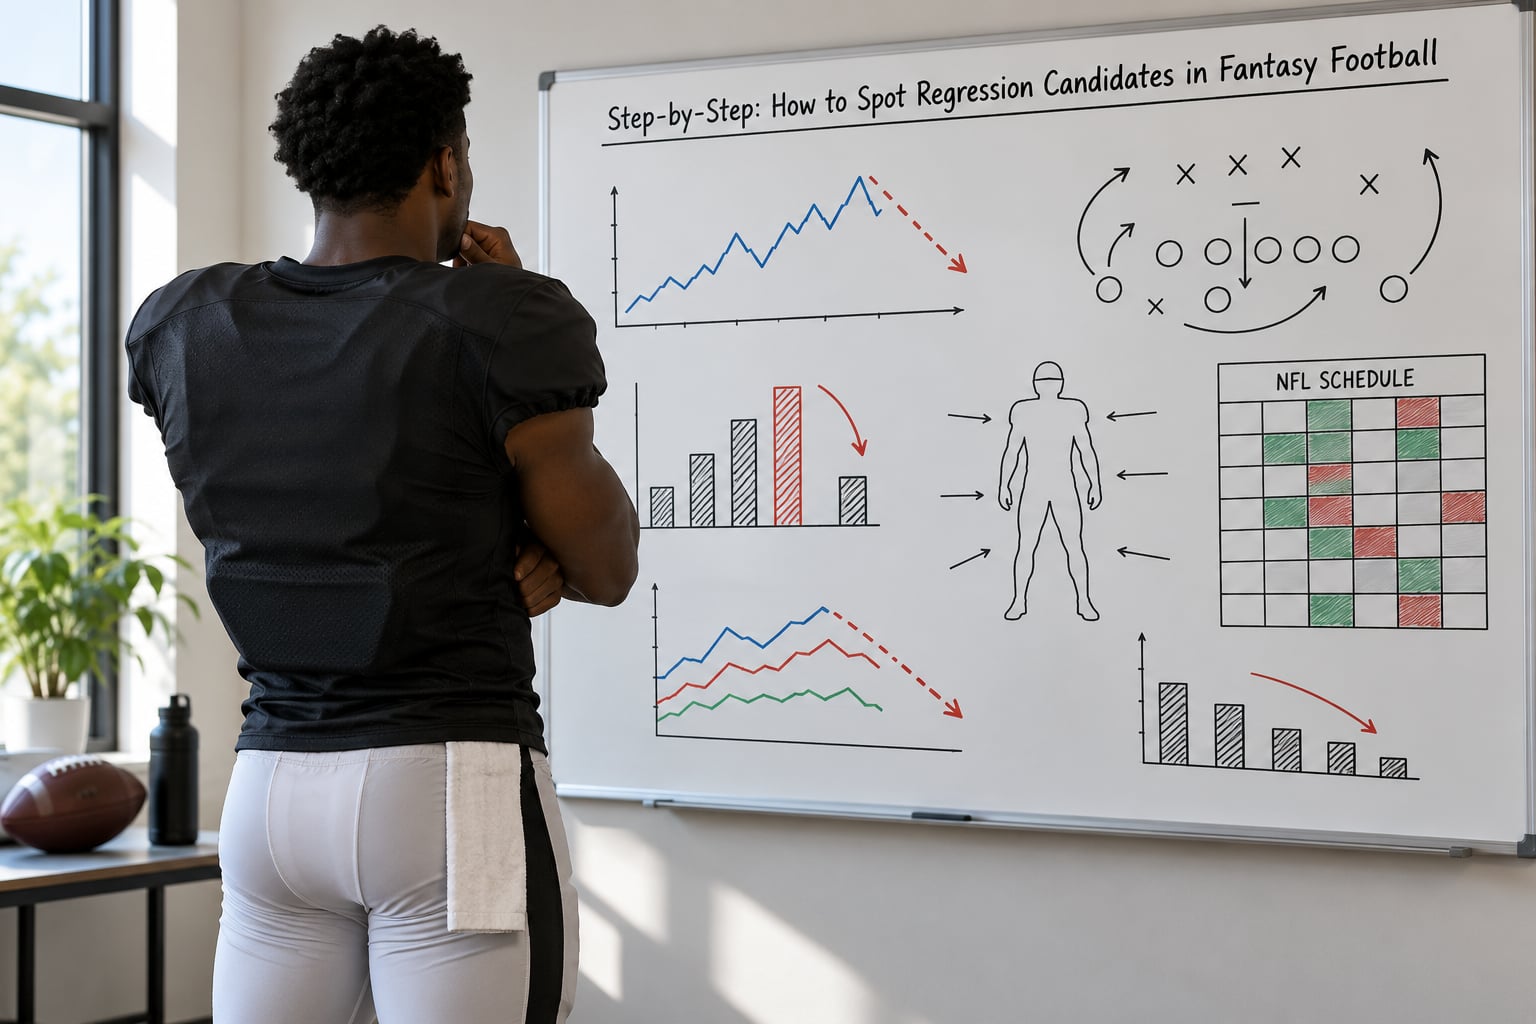
Five steps, done in this order. Skipping ahead to step four is the usual reason a promising rebound turns into a wasted roster slot.
1. Identify the Player’s Actual Role
A down season means nothing until you know what the player is actually being asked to do. Start with targets and snap share, then layer on route participation, which catches players who stay on the field but run only short, low-volume routes.
For receivers, red-zone targets and goal-line touches carry more weight than raw targets. A wideout with 100 targets and no red-zone work has a lower ceiling than one with 70 targets and regular looks inside the 10-yard line, even though the raw target count says otherwise.
For running backs, split carries from receiving work. A back averaging 18 touches per game who catches four passes is a completely different asset from one with the same rushing volume and one target per game, and the weekly box score will not tell you the difference unless you look at routes.
Check who the competition is. A young running back drafted in the first round who is already taking single-digit goal-line carries will eventually take the work, whether the coach says so or not. That is a future opportunity signal rather than a current one, which is a very different buy.
How to tell it worked: you can state the player’s role in one sentence, with a number attached, and that number has not moved more than a game or two in either direction during the sample period.
2. Separate Bad Luck From a Real Trend
Some slumps are noise. The way to tell is to look for concentration. If 70 percent of the damage came in two games against defences that ranked top in the league against that position, you are looking at variance, not decline.
The usual culprits are known: missed touchdowns in the red zone, fumbles that cost a workhorse a third of his season in one afternoon, drops on a handful of targets, and games where the quarterback simply stopped looking at a player he leaned on early in the season. None of those change a role. All of them show up in a player’s actual points while leaving his expected points untouched.
Sample size is where most analyses fall apart. Three or four weeks of data is barely a signal, and anyone who trades on it is guessing. Forum consensus across the fantasy communities lands somewhere around eight weeks before the numbers mean much for most players, and roughly a full season for running backs whose workload can swing wildly on a single injury.
Watch for trends in the underlying numbers instead of the totals. If expected fantasy points have been flat for six weeks while actual points climb, the player is running hot. If both are falling together, that is a decline and no amount of luck talk will fix it.
How to tell it worked: you can list the specific games or events causing the gap, and none of them touch the player’s role.
3. Check the Schedule and Team Environment
Opportunity is not evenly distributed across a season. A receiver facing the league’s best pass defences for five straight weeks will produce ugly numbers while his role stays intact, and that is a completely different asset from the one struggling because his team runs 12 possessions a game.
Look at team pace. Plays from script, offensive line quality and quarterback style all change how many chances a player gets. A new offensive coordinator who leans on play-action means a downfield receiver’s air yards share matters more than short passes to running backs.
Coaching continuity is the quiet signal people miss. When a quarterbacks coach changes, the previous backup becomes a potential regression candidate simply because the model no longer applies. Same when a team replaces its starting tight end with a rookie drafted to do the same job.
Finally, run the injury and depth chart check before you commit. Preseason depth charts are frequently wrong by the time the regular season is a few weeks old, and they are not evidence of anything once the season starts.
How to tell it worked: the player has a clearly easier stretch coming, or a clearly harder one, and you know which side of that fence he is on.
4. Compare Production With Advanced Trends
This is where the process turns from opinion into measurement. Pair what the player produced with what his opportunities were worth, and the gap tells you which direction to lean.
- Expected fantasy points (xFP). Points implied by targets, carries and field position. A rebound signal is actual points sitting well below xFP across six or more games.
- Points over expected (FPOE). Actual minus xFP, usually reported per game. Underperformance of two or more points per game is the version of the same idea you can sort by quickly.
- Yards per route run (YPRR). Receiving efficiency independent of volume. Strong YPRR alongside low target share is the cleanest buy-low profile in the game.
- Target share. A player’s share of a quarterback’s looks. A rising trend while raw numbers stay flat means volume is coming before results are.
- Touchdown rate. Touchdowns as a share of red-zone opportunities. Well above 7 percent, or well below his own multi-year baseline, tells you which direction luck is pulling.
- Air yards per route. Depth of target and therefore quality of chance. Low figures with a quarterback who pushes the ball downfield usually mean a scheme change, not a talent problem.
The most useful pair is YPRR with target share. A receiver posting elite YPRR on a modest number of targets is telling you that every ball thrown to him is being converted, and the only variable left is volume. Volume is decided by coaches and quarterbacks rather than by luck, which is why that profile holds up better than a touchdown-dependent one.
Expected points added works at the play level and is less available for free, so I treat it as confirmation rather than the primary screen. A receiver running routes behind a struggling offensive line may show excellent EPA on his own routes while his team simply cannot get to the red zone, and that context belongs with the schedule check rather than this list of metrics.
How to tell it worked: the efficiency numbers and the volume numbers disagree in a way that the schedule can explain, and the disagreement points to a plausible increase in opportunity.
5. Set a Reasonable Ceiling and Buy-In Price
Once the thesis is clear, put a number on it. The useful output is a range, not a point estimate, and the range should be built from a volume assumption times an efficiency assumption rather than from the player’s best game of the season.
If a receiver is averaging 5 targets a game and converting at 3.0 fantasy points per target, then volume at 8 targets is the ceiling and 6 is the realistic case. That is a two to four point weekly swing, which across a full season is the difference between a replacement and a starter. It is a much better basis for a trade offer than quoting someone else’s projection.
Then set your buy-in based on evidence quality, not enthusiasm. Three independent signals pointing the same way, such as stable efficiency plus rising share plus an easier schedule, support a larger add than any single one alone. That is also your answer when a trade partner pushes back, and it turns a hunch into an argument.
Format matters too. A buy-low add on a player coming off a bad week can be worth doing in redraft regardless of format. In dynasty, the same player is a multi-year bet, so his age, contract and draft capital decide whether the rebound matters. A 29-year-old running back with an efficient season ahead of him is a different asset from a 24-year-old with three years of upside.
How to tell it worked: you can say what would have to happen for the player to meet your projection, and you know how many things have to go right.
Common Mistakes When Finding Regression Candidates
Almost every failed regression play traces back to one of these. The fixes are simple, which is good, because they cost nothing.
- Buying an aging player on name alone. Production curves downward, and a rebound for a 32-year-old tight end is a two-week story at best. Fix: check age and contract before the role analysis, not after.
- Ignoring that opportunity left. A player can be efficient all year on falling volume and still be finished. Fix: require a role signal, not just an efficiency signal, before you act.
- Treating a small sample as truth. Four weeks of data produces confident nonsense, particularly for players returning from injury. Fix: wait for eight weeks or a full season, whichever comes first.
- Pricing off last season’s finish. If a player was the most logical first-round pick last year, other managers value him accordingly whether or not he declined. Fix: project him, then note that the market disagrees.
- Buying players whose roles are shrinking. Younger players taking the snaps is a ceiling, not a floor. Fix: check the depth chart and the goal-line work before you do anything else.
- Confusing touchdown variance with ability. A receiver with ordinary yards per route run and a huge touchdown total will not sustain it. Fix: compare touchdown rate to his own multi-year baseline, not to his position average.
- Ignoring negative regression entirely. Sell-high decisions make the buy-low side of your roster possible. Fix: run the same five steps in reverse for your best performers every few weeks.
Two habits keep the analysis honest. Write the thesis down before you check the price, so you know what you believed when you formed the opinion. And revisit names on a schedule, because a regression case that never improves over six weeks was probably a decline case from the start, no matter how good the efficiency numbers looked.
Frequently Asked Questions
What is regression in fantasy football?
Regression in fantasy football is the statistical tendency for a player’s production to move back toward their true ability after an outlier stretch. Hot and cold stretches happen because touchdowns, yards per carry and completion percentage vary far more week to week than skill does. A manager spotting regression compares actual fantasy points to expected fantasy points based on opportunity, then asks whether the gap is likely to close.
How long should I wait before buying a regression candidate?
Most managers land on about eight weeks of data before the signal is worth acting on, and closer to a full season for running backs whose workload depends on one injury. The first three or four weeks are mostly noise, especially for players returning from a long absence. If the underlying role numbers are already moving, you can start building a case, but hold the add until the sample is real.
How do I tell regression apart from a genuine decline?
Regression shows up as a gap between actual and expected fantasy points while the role numbers hold steady. Decline shows up everywhere at once: falling target share, shrinking snap counts, worse efficiency and worse results. If efficiency improves while the player gets fewer chances, that is a volume problem, not a talent problem, and it needs a roster change rather than patience.
Does last season’s production matter when identifying regression candidates?
It matters as context, never as a forecast. A season’s touchdown rate and target share are useful baselines for judging whether the current year is hot or cold, and multi-year trends reveal aging curves. But treating last year’s finish as a projection is the most common drafting mistake in the sport. Project from role and opportunity, then notice where the market is anchored to last year.
How do stat corrections work in fantasy football?
Official stat corrections can change a player’s totals after a game is reviewed, usually for a miscredited catch, a fumble ruling or an on-field stat error. That matters for regression analysis because a single correction can move weekly points enough to distort a trend. Use a source that applies corrections promptly, and re-check a player’s record if a suspected correction lines up with one of his bad games.
What is the best way to find regression candidates on waivers?
Sort a free expected fantasy points leaderboard by points over expected, filter to players with at least six targets or twelve touches per game, then read the weekly participation log. Candidates worth claiming have a stable or rising role, efficiency numbers that are better than the results suggest, and a favourable stretch of schedule coming. Ranked the wrong way, a negative regression player looks identical to a rebound candidate.
Conclusion
Finding regression candidates is a filtering process, and the filters do the work for you. Start with role, confirm the gap is variance rather than direction, check the schedule, then read the efficiency numbers, and only then decide what the player is worth to you.
Open a free expected fantasy points leaderboard, sort by points over expected, and write down the role note for the five most interesting names on both ends of the list. That single sitting will produce better trade and waiver decisions than a full week of reading hot takes.