
How to value relief pitchers and saves in fantasy baseball comes down to three questions in order: what does your scoring system actually pay for, how good is the arm underneath, and how many save chances does he realistically get? Add a fourth step most managers skip, which is dividing that projected production by what the pick costs in your draft or auction. Get those four right and the position stops being a guessing game.
A closer you took in round three can finish the season with 12 saves if he loses the job in May. A setup man you took in round twelve can go 2-0 with a 2.10 ERA and a 38% strikeout rate and be more valuable than the closer. Neither outcome is predictable from a name alone, so this is a process, not a list.
Table of Contents
What You Need
Before you can value a single reliever, you need the inputs that turn a scouting opinion into a number. Most managers have three or four of these and guess at the rest, which is why their bullpen decisions feel arbitrary.
| Input | Where to get it | Why it changes the call |
|---|---|---|
| League format and scoring system | Your league settings page | Decides whether a save is worth 8 points or 4, and whether a hold is even scored |
| Roster and role | Team depth chart, recent box scores | Tells you which bucket the pitcher occupies today |
| Save chances and holds | Team-level and pitcher-level season totals | The raw material for any projection |
| Innings pitched and appearances | Season logs | Reliever work is not consistent week to week |
| Strikeout rate, walk rate, K-BB% | FanGraphs, Statcast-based sites | Skill metrics that do not depend on results |
| ERA and WHIP | Any stats page | Scored in most leagues, and heavily luck-driven |
| Opponent quality and park factor | Team offense splits, park factors | A pitcher in a hitter’s park needs more underlying talent to post the same ERA |
| Injury, workload and role-change news | Beat writers, team transaction pages | Closer jobs change without a single plate appearance |
| Rest-of-season projection | Steamer, ATC, or a major site’s projections | Converts talent and role into the numbers you actually score |
Two of those deserve more attention than they get. Leveraged situations, not total innings, tell you how a pitcher will be used when games are tight. And save chances created by the team, not saves converted by the pitcher, tell you the ceiling of the job.
Step-by-Step: How to Value Relief Pitchers and Saves in Fantasy Baseball
1. Set the relief pitcher’s fantasy role
Role determines the ceiling, and a closer label on a depth chart tells you far less than people think. Sort every reliever you are considering into five buckets before you look at a single statistic.
- Closing closer: ninth-inning job, save upside, leverage concentrated in a small number of appearances.
- Setup man: eighth-inning job, holds and the occasional save if the closer is unavailable.
- Late-inning or high-leverage arm: no fixed inning, enters in tight games, no reliable saves.
- Middle reliever: sixth and seventh innings, little leverage, work driven by pitch count and game script.
- Situational or streaming arm: low-leverage appearances, cheap upside in daily and weekly lineups.
A nominal closer with no competition on his team is a different investment from one of three arms on a bullpen committee. Teams with three or more save-eligible relievers are not a landmine for you, they are an opportunity: the innings and strikeouts are still available even when the saves are not.
2. Map the save and hold opportunities
Save opportunity is the most underrated number in the category, because it belongs to the team rather than the pitcher. A club that wins a lot in one run games generates chances; a club that wins often in comfortable margins creates far fewer of them.
| Role tier | Saves available | Holds available | What you are actually buying |
|---|---|---|---|
| Confirmed closer | 25-45, wide range | 0-2 | The whole saves category, if the job holds |
| Closest competitor | 5-15 in a good year | 5-15 | Holds plus vulture saves and real innings |
| Setup man | 0-5 | 20-35 | Late-inning work and leverage innings |
| High-leverage middle reliever | 0 | 0-5 | K-BB skill and ratio points |
| Low-leverage arm | 0 | 0 | Strikeouts and innings, nothing more |
The volatility is the whole point. In the 2026 season, about 52% of saves went to the team that started the season with the closer job, and only eight closers reached 30 saves. That is a wide spread for managers drafting on assumption rather than evidence.
Two of the three closer jobs change hands in a given season. Only 47 relievers have posted 35 or more saves at age 30 or older since 2000, which tells you how quickly the role ends even when the pitcher stays good.
Age is the hidden variable in every one of those numbers. Younger closers still have innings and leverage ahead of them, older ones are fighting for a shrinking job. On a keeper or dynasty roster that runway is the whole valuation, and it is exactly the kind of thinking that gets skipped in redraft leagues.
Check whether your league scores holds at all before you price them. In a large survey of roto formats, 43% of leagues counted saves only, 37% used a combined saves-plus-holds category, and 20% counted them separately. In a third of your league, a setup man is a nonentity.
3. Measure skills independently of results
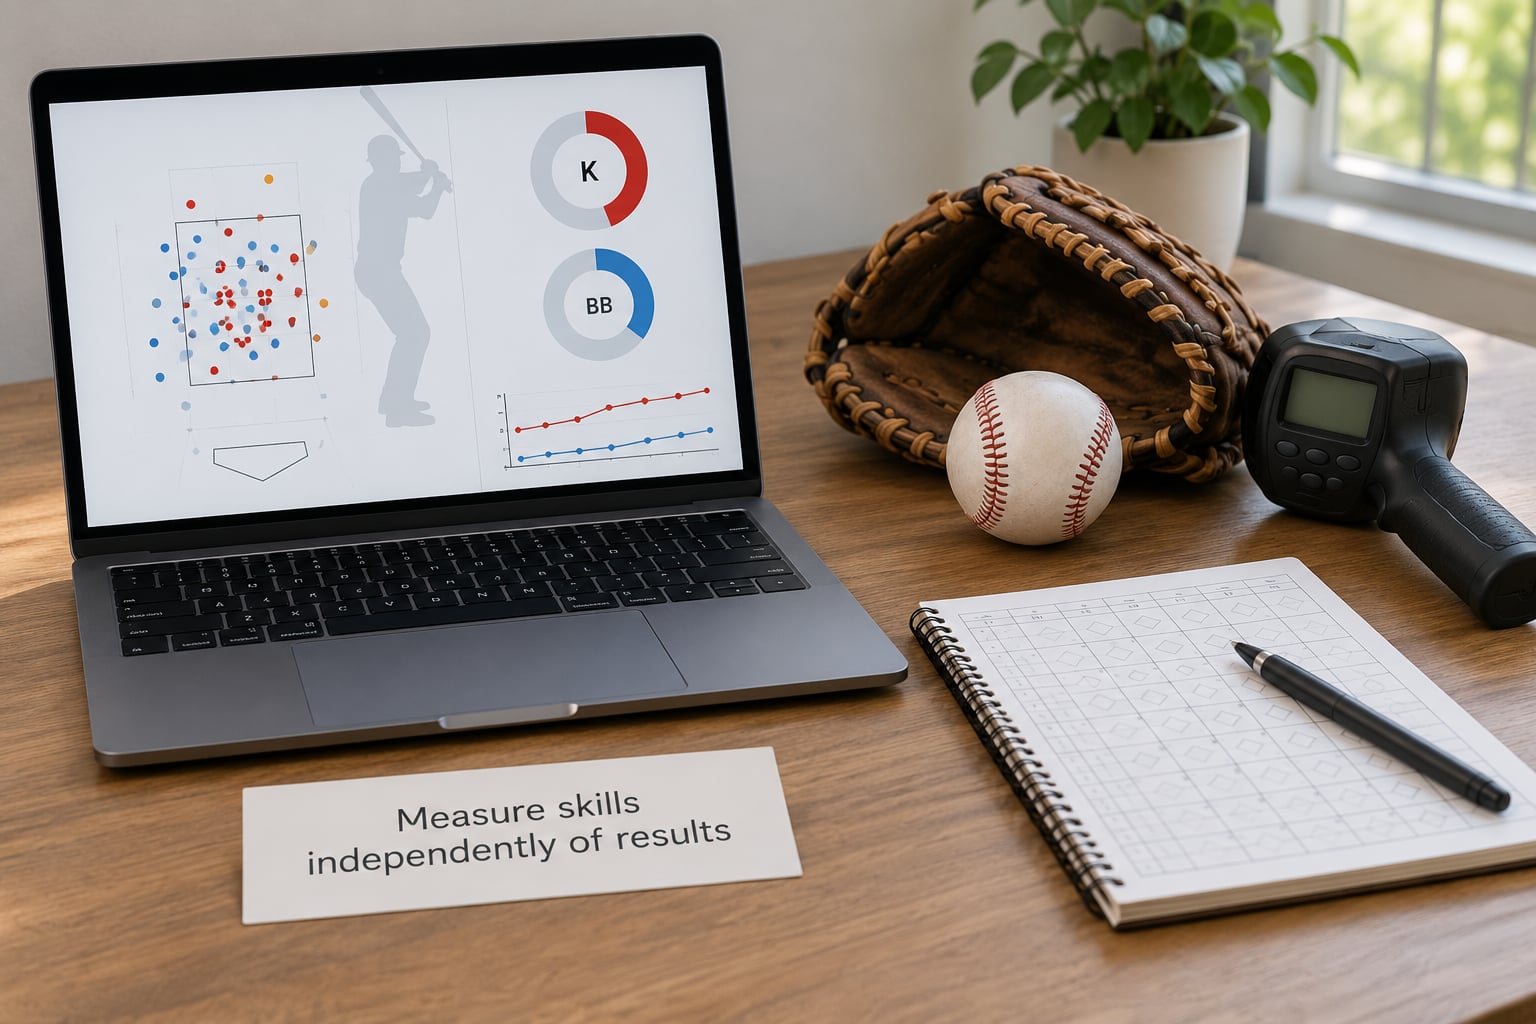
This is the step that keeps you out of trouble. ERA and saves are outcomes. Strikeouts, walks and whiff rates describe what the pitcher actually did to the ball, which is the part that repeats next season.
| Metric | Pass mark for a reliever you want to own | Why it matters |
|---|---|---|
| Strikeout rate | Above 28% | The clearest repeatable skill signal for relievers |
| K-BB rate | 20% or better | Commands the strike zone, survives bad contact luck |
| Whiff rate | Above 30% | Measures how often the pitch misses the bat, bat-independently |
| Chase rate | Above 38% | Tells you the pitch works out of the zone, where relievers live |
| xBA against | Below .240 | Strips out batted-ball luck that inflates or sinks ERA |
| Average exit velocity allowed | Below 88 mph | Separates dominant relievers from lucky ones on weak contact |
| Velocity | 95 mph or better on the fastball | A late-inning weapon needs to miss bats out of the zone |
| Sweeper or high-spin breaking ball usage | Rates above average for the role | Current stuff trends reward chase ability over a pure fastball |
A closer can post a 2.40 ERA on a 15% strikeout rate with a 2.50 K-BB% because the batted balls landed where fielders happened to be standing. Give that pitcher the same role next season and the ERA usually regresses toward the talent level underneath. This is how you value relief pitchers and saves in fantasy baseball without letting one inflated number drive an auction bid.
The reverse happens too. A reliever who carries a 4.00 ERA with a 30% strikeout rate, a 25% K-BB% and a low chase rate is usually just unluckily timed, and his next month looks much better than his last one.
4. Normalize the performance sample
Relievers throw small samples in high-leverage spots. Twenty appearances in April tell you almost nothing about a full season, and the ninth inning of a tied game tells you even less than that.
Correct for these four distortions before you believe any line:
- Role changes. A pitcher moved from setup to middle relief loses leverage innings; the raw ERA may improve while the fantasy value falls.
- Extra innings and low-leverage appearances. Two scoreless innings in a fourteen-run game inflate a save total more than a season of work.
- Opponent and schedule quality. A week against four weak lineups produces results no pitcher repeats all season.
- Roster turnover. A bullpen reshuffle mid-season changes who throws the ninth, which changes the fantasy math more than any pitch.
Use recent form as supporting evidence for a projection, never as the projection itself. A reliever with two great outings out of six has shown a range, not an upgrade.
5. Adjust for team and park context
A better offense creates more save opportunities without making your pitcher better. Keeping those two ideas apart is what stops managers from paying for a good team’s bullpen twice.
- Expected save chances: look at one-run games and late-inning leads, not just the final save total.
- Bullpen competition: count the save-eligible arms on the roster, not the one in the box score today.
- Closer health: reliever workloads are short, so injury risk is higher and return timing is harder to predict than for a starter.
- Defense: a bad shortstop turns routine ground balls into errors and inflates everyone on the mound above him.
- Park factor: the same pitcher in a hitter-friendly park needs more underlying quality to post the same ERA.
Note the asymmetry that makes closers different from starters. A starting pitcher can improve through role, pitch design and workload. A closer’s job can be taken away by a single bad week, a trade, or a demotion for workload reasons. Discount that risk in the projection rather than in the price after the fact.
6. Build the projection and convert it to fantasy points
Build the projection in this order: talent baseline first, then role, then opportunity, then health, then form.
- Talent baseline: start from a projected ERA and K-BB% for the role, adjusted for the underlying metrics from step 3.
- Role: apply expected innings and leverage appearances for the bucket you assigned in step 1.
- Opportunity: multiply team save chances by your estimated share of the job to get projected saves and holds.
- Health: shave the projection for injury history and workload uncertainty, more heavily for relievers than starters.
- Form: let a genuinely sustained run move the projection slightly, and nothing more.
Then run it through your league’s scoring rules. The same projection produces very different values in different formats, which is why the format check comes first.
| Format | What the reliever is worth | Draft approach |
|---|---|---|
| Standard 5×5 roto | Saves category plus ratio and strikeout contribution | Take closers late, expect to add more on the wire |
| Saves plus holds | Holds raise the value of the eighth-inning job | Two competent late-inning arms beat one volatile closer |
| Points league | Strikeouts, saves and IP all scored directly | Regulars in these formats take a closer by round three |
| Auction | Whatever your league mates will pay, which is usually the saves | Bid on the role, price the talent separately |
| Keeper or dynasty | Multi-year save runway and age curve | Pay a premium for young closers, discount the aging ones |
Savings are countable, which makes cost per projected save the cleanest valuation metric available. If your closer is projected for 28 saves and you paid a late second-round pick for him, you are paying for a category win. If a 15-save closer cost you the 11th pick of round 15, that is a punt you have already funded.
7. Compare value with the alternatives
Every reliever competes with other pitchers for the same pick, so the last step is always relative. Price a reliever against starting pitchers at the same cost, against other closers, and against the replacement level of the position.
Points league managers have reported drafting a closer early and then snaking the top fifteen closers whenever they fell into their pick window, because closers are scarce at every level of the draft board and the tail is thin. Rotowire readers and auction participants use a different screen entirely: one manager on a well-known fantasy baseball forum described landing two cheap closers in an auction for single-digit bids and still finishing fifth in the saves column. Nobody had paid for saves in that league.
Adjust for scarcity, your league’s roster rules, which categories are dragging your team down, and the risk discount a volatile role deserves. A closer projected for 40 saves in a committee bullpen deserves a bigger discount than one projected for 40 with no competition, even though the projection looks better.
Scouting reports and expert rankings are also a valuation tool. Relievers drafted in the first 100 picks average around the 29th pick overall in 12-team mixed competition and around the 24th in 15-team draft champions formats, and somewhere between 12 and 15 relievers typically go inside the top 100. If your target is going in the 140s and the saves category is already your worst, you are drafting a replacement closer and paying a premium price.
Common Mistakes
Almost every bad bullpen decision traces back to one of eight habits. Each has a straightforward correction.
- Ranking the position by total saves. Fix: project saves per dollar or per pick, and check whether the total assumes the pitcher holds the job all season.
- Assuming every team has one stable closer. Fix: count the save-eligible arms on each bullpen before assigning shares, and expect roughly half of all saves to go to the team’s original closer.
- Ignoring setup-man holds. Fix: check whether your format scores holds. In saves-plus-holds leagues a strong eighth-inning arm is often the better buy than a third-ranked closer.
- Using unadjusted ERA. Fix: screen for strikeout rate and K-BB% alongside ERA, and pull whiff, chase and expected batting average before you bid.
- Overreacting to a short sample. Fix: weight a full season of underlying metrics over six outings, whatever those six outings did.
- Double-counting saves and ERA. Fix: saves arrive in low-leverage innings that flatter ratios. Judge the ratio skill and the save opportunity separately.
- Overlooking injury and workload news. Fix: check the transaction log weekly. Closer jobs move without a single appearance.
- Treating last year as this year’s projection. Fix: rebuild the projection from talent and role every year. Age alone moves a closer several spots in a keeper valuation.
For daily and weekly leagues, the routine is simpler and the volume matters more. Streaming sites handle the low-leverage arms; your job is the closers and the high-leverage middle relievers. One manager described a weekly hour spent screening strikeout rate, ERA and WHIP outliers in a spreadsheet, which surfaced several top-30 season relievers mid-season at nearly no cost. Box scores read bullpen reality faster than any preview or press conference, and reading them weekly is how you catch a job change before the saves category decides it for you.
Frequently Asked Questions
How do I value a relief pitcher who has saves but a poor ERA?
Judge the two parts separately. Save opportunities come from the team’s one-run record and his share of the closer job, so they survive one bad outing. ERA is an outcome that regresses hard. Screen his strikeout rate, K-BB%, whiff rate and expected batting average. If the underlying metrics are strong and the ERA is not, the ERA is telling you about batted-ball luck and defense more than about his ceiling next season.
Are setup men worth drafting in points or roto leagues?
It depends almost entirely on whether your format scores holds. In saves-plus-holds leagues a good setup man can outproduce a committee closer, because holds are a large share of his workload and his ratio metrics come in leveraged innings. In saves-only formats his value is usually just strikeouts and innings, which makes him a streaming or flex option rather than a draft target. Check the settings page before you decide.
When should I drop a closer after a bad outing?
Judge the job, not the outing. One blown save costs almost nothing if he is still pitching the ninth. Look for the signals that matter: a new closer on the box score, a reduced leverage share, an injury report, or two consecutive weeks below his baseline on underlying metrics. Save your spot for a replacement closer the same day you see the role change, and make the swap before the rest of your league notices.
Should I care about ERA in daily or weekly fantasy baseball?
In daily lineups ERA mostly decides your win, so it matters, but one appearance moves it more than the entire season in roto. In weekly leagues, treat ERA as a noisy category and put more weight on strikeouts, holds and role security. Most points leagues score ERA, so you cannot ignore it, but you should expect the luck component to unwind over a full season.
How do I evaluate relief pitchers after an injury?
Start from the recovery timeline rather than the old stat line. Relievers are back in the role in days but rarely at full workload, so project fewer innings than before and assume a reduced leverage share for the first two or three weeks. Then check whether the injury changes the job itself, since a team that survived without a closer often does not hand it straight back. Discount the pre-injury projection by the time lost.
Conclusion
Start with the format, name the role bucket, project save and hold chances from the team’s depth chart, measure the arm with strikeout and K-BB metrics instead of ERA, apply a discount for health and competition, then price the result against the alternatives. Do that in that order and the bullpen stops being the least predictable part of your roster. Pull up your own league’s settings and depth chart right now, then run one pitcher through all seven steps.